Cardano’s price has witnessed a notable surge over the past 24 hours, climbing nearly 10% amid a spike in trading activity. This rally is backed by increased demand for the altcoin, reflected in the rise in its trading volume. This has exceeded $1 billion during the period in review.
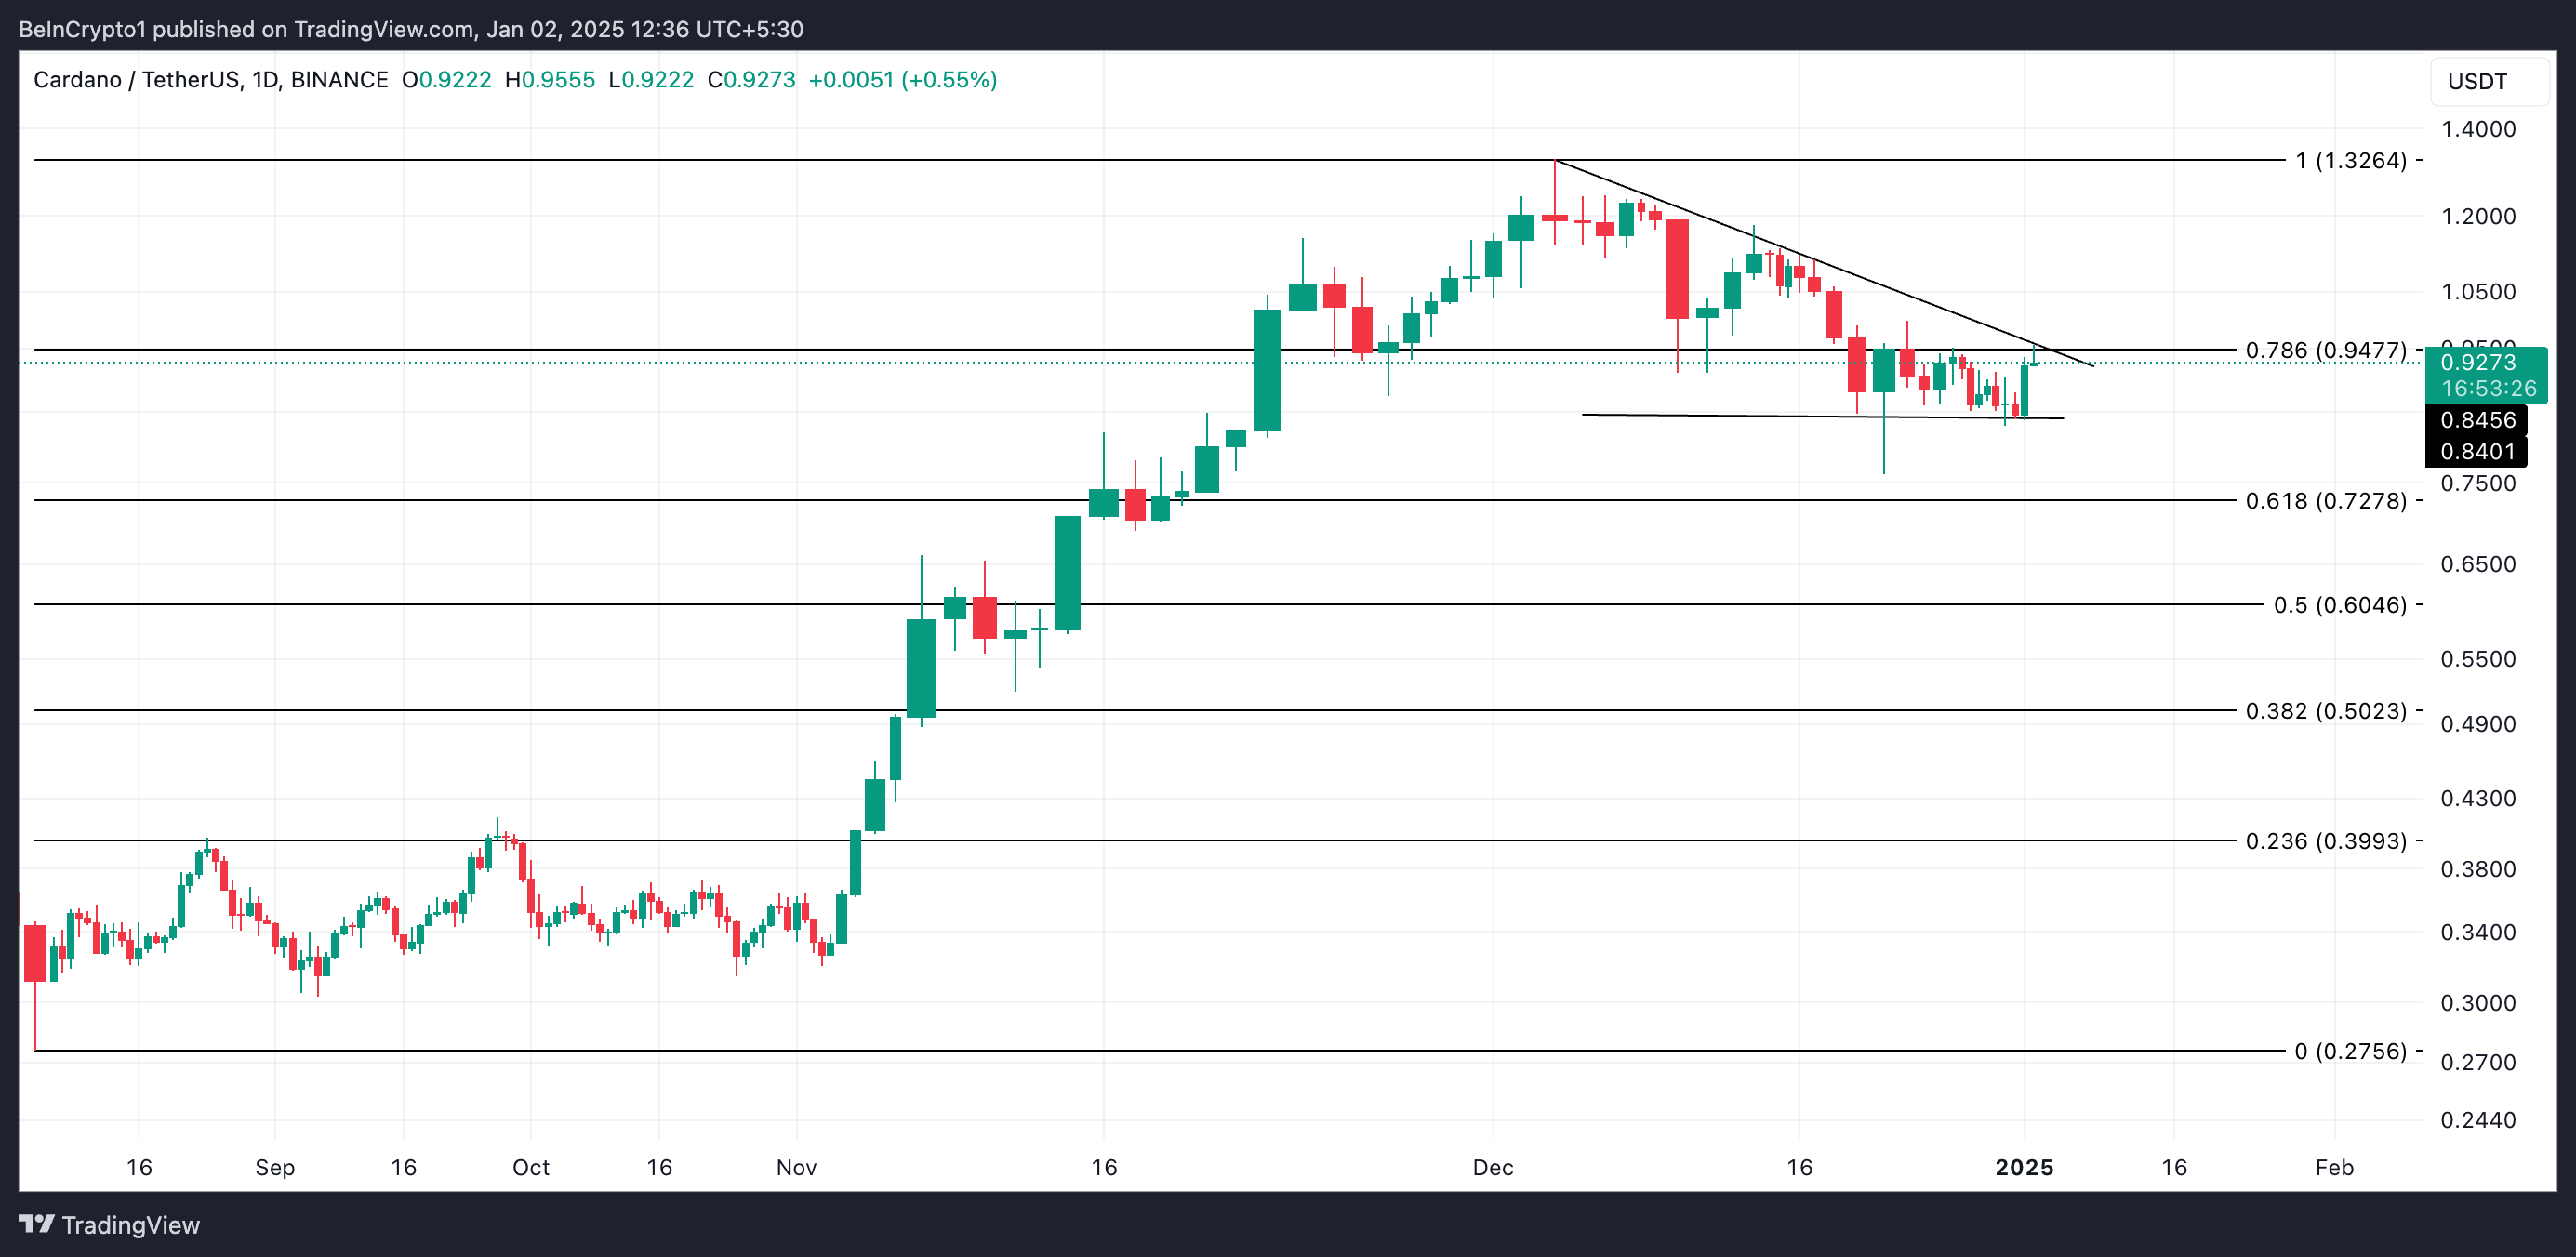
Technical analysis suggests that if buying pressure is maintained, the Cardano price could reclaim its two-year high of $1.32. Here is how.
Cardano Nears Breakout from Bearish Pattern
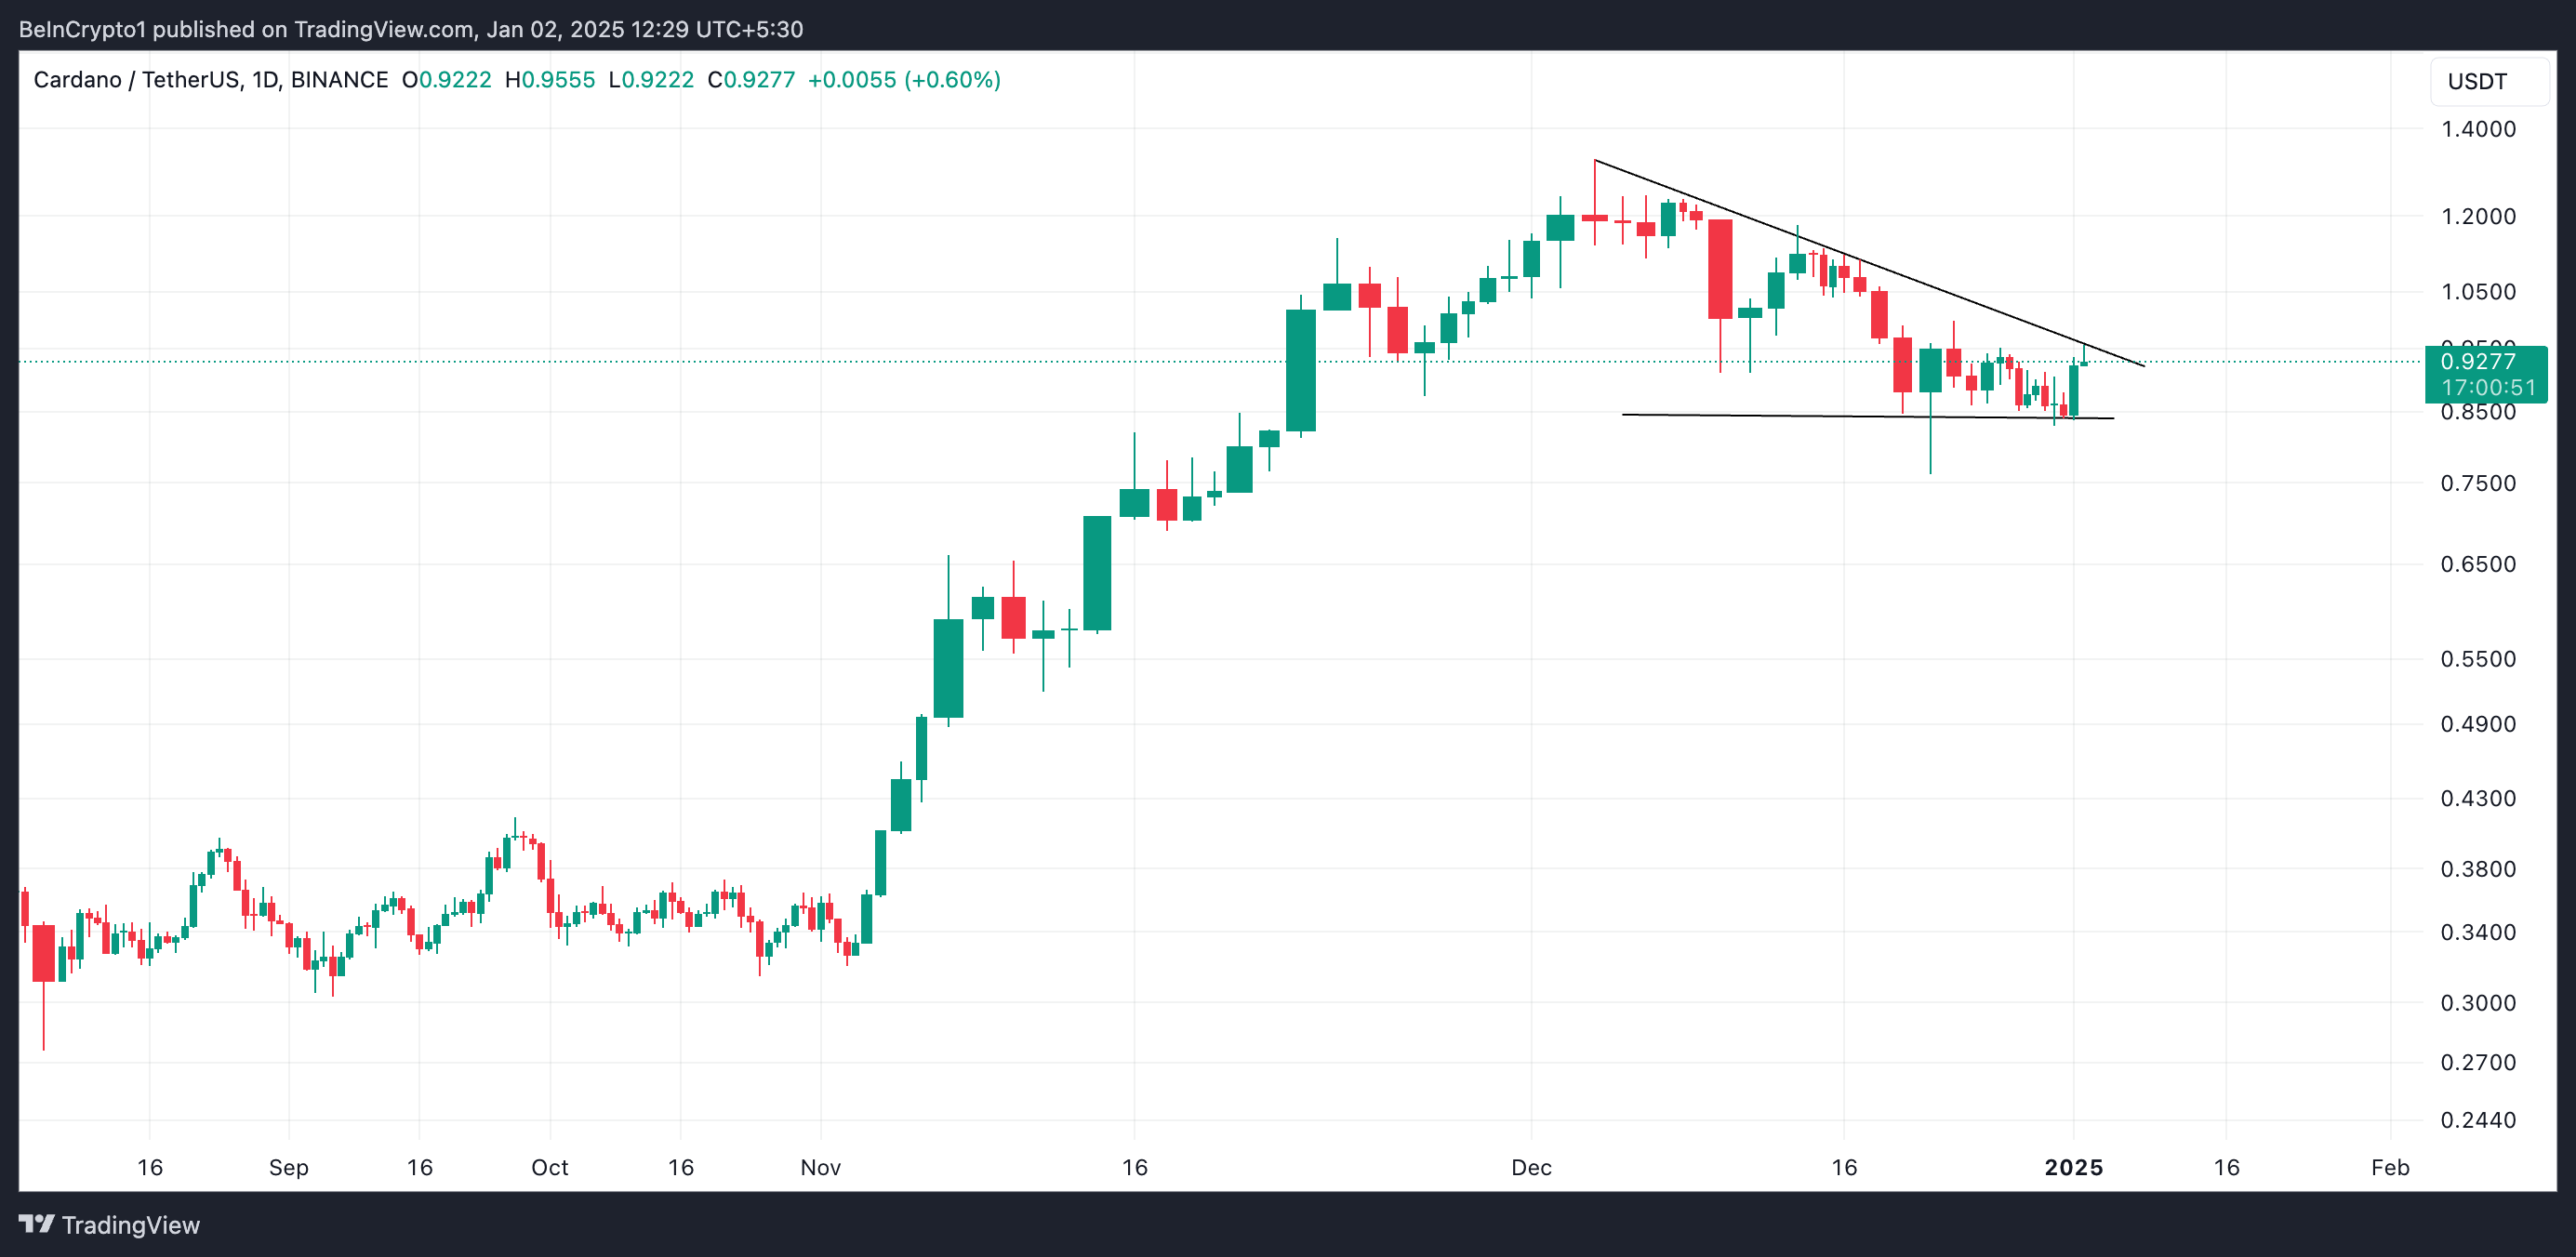
BeInCrypto’s assessment of the ADA/USD one-day chart shows that Cardano has traded within a descending triangle since December 3, when it climbed to a two-year high of $1.32. This bearish pattern forms when an asset’s price makes a series of lower highs while maintaining a horizontal support level. It indicates a spike in selling pressure as traders offload their holdings for gains.

However, the resurgence in ADA demand over the past 24 hours has driven its price to the upper line of the descending triangle, positioning it to potentially break above. When an asset’s price nears the upper line of a descending triangle, it signals a potential retest of resistance within a bearish continuation pattern. A succesful breakout above this line would signal a bullish reversal and confirm the strength of the uptrend.
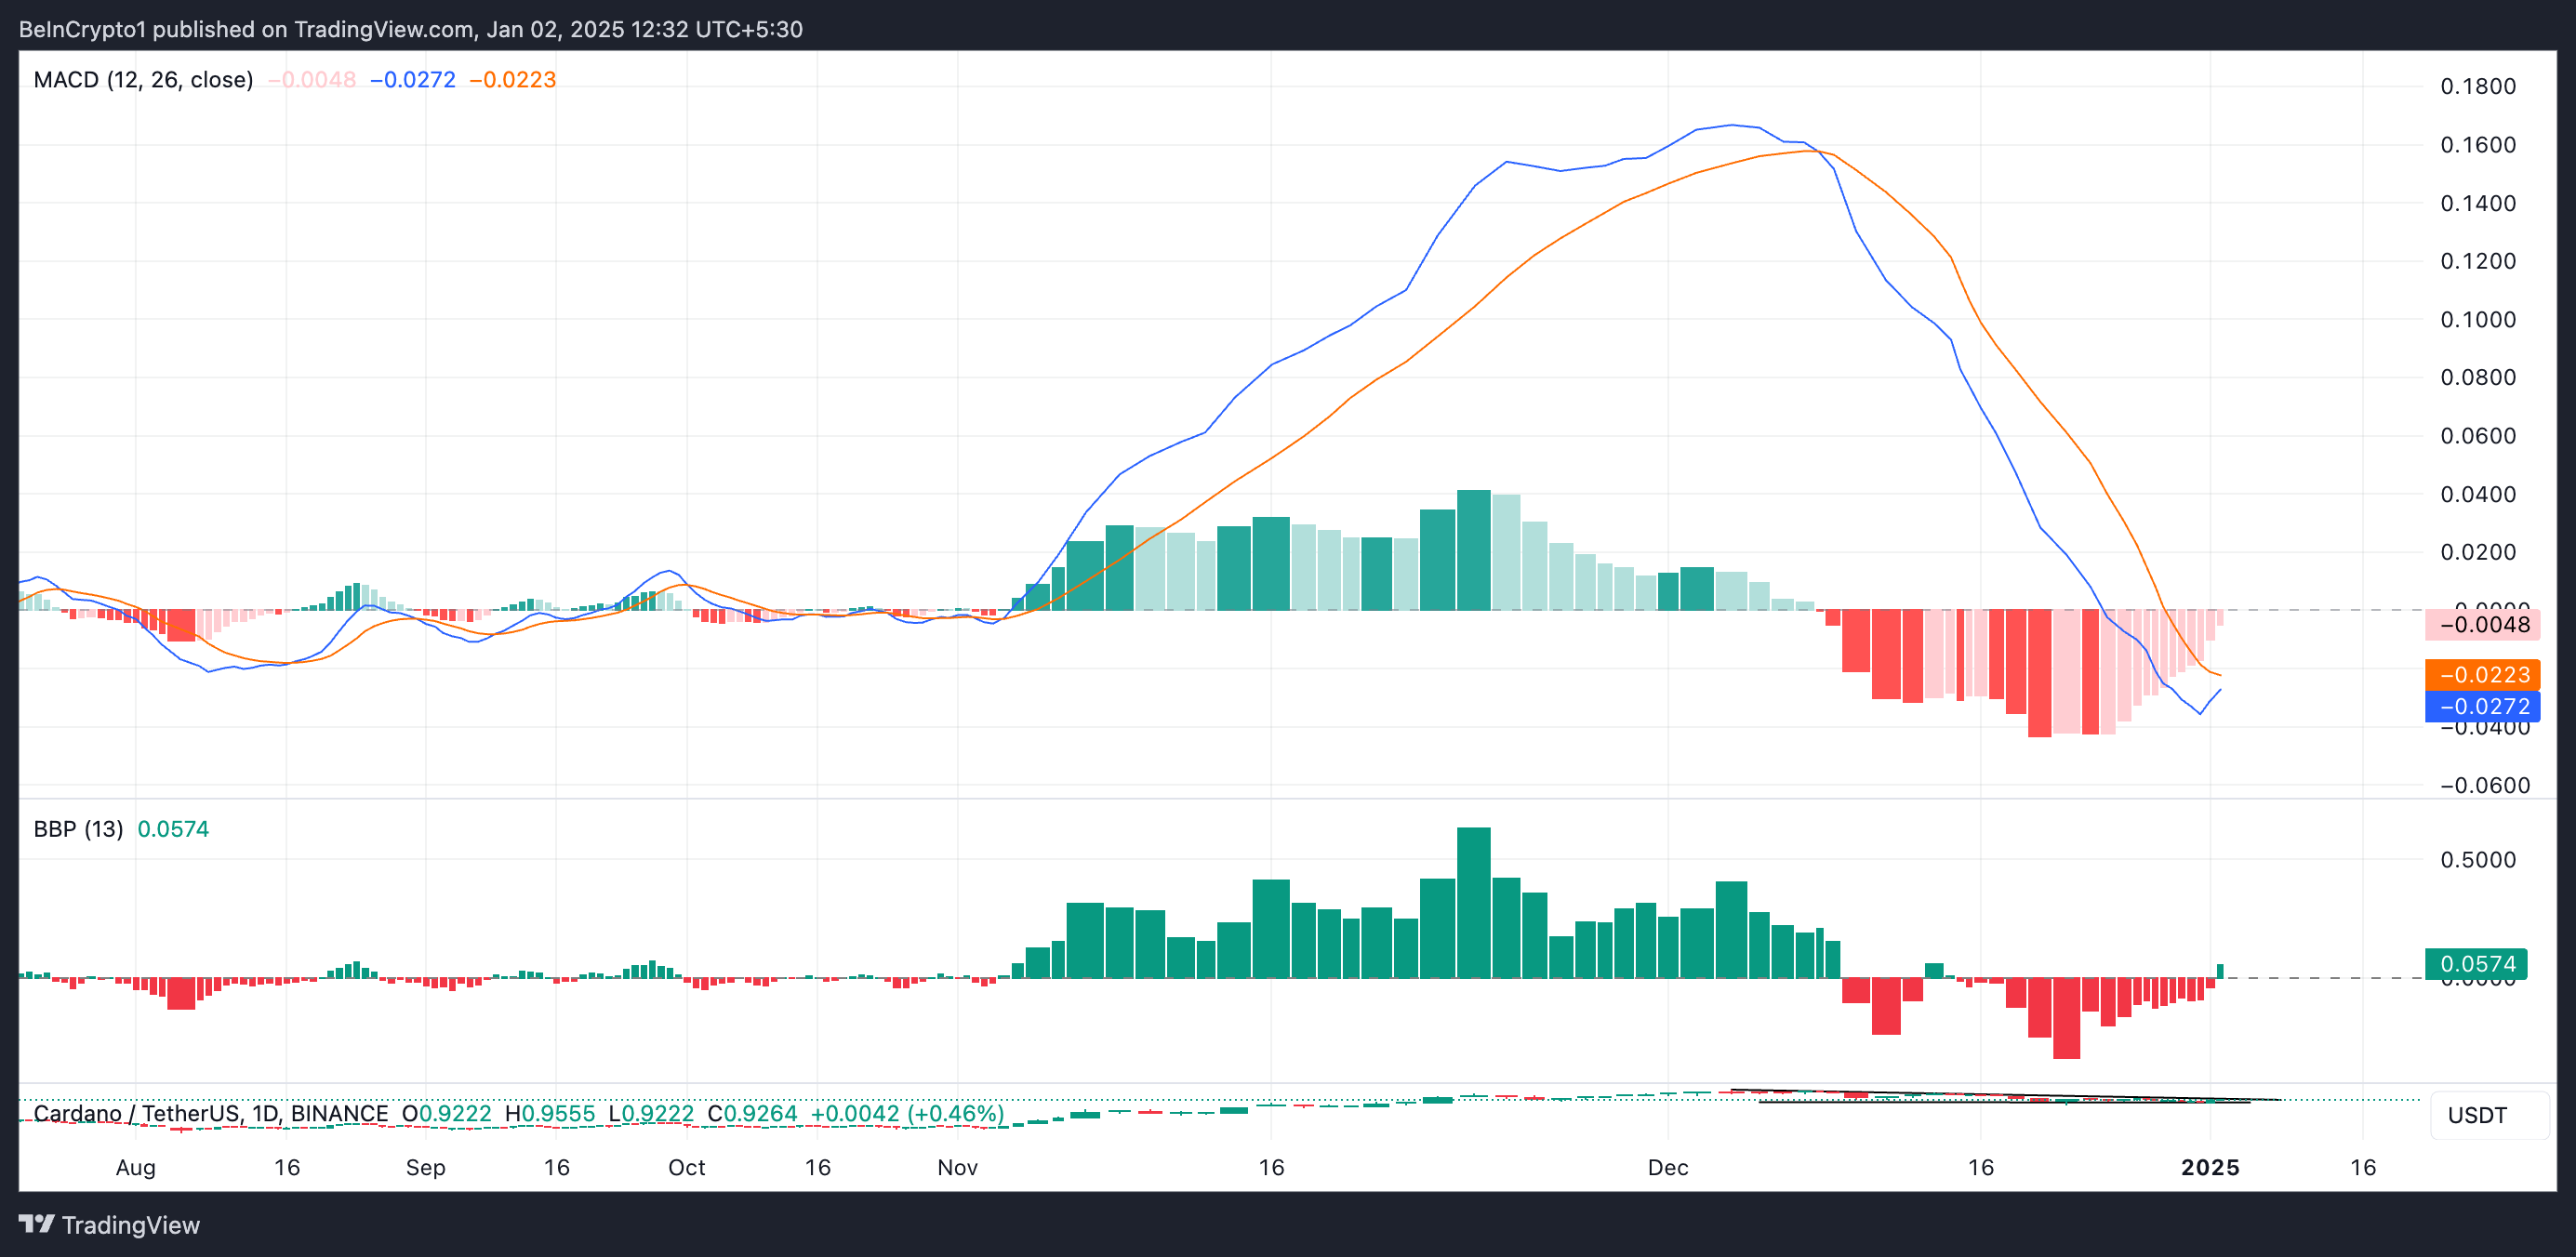
According to readings from the ADA daily chart, this breakout may occur soon as buying pressure gains momentum. For example, the coin’s Elder-Ray Index has returned a positive value for the first time since December 13, further confirming this bullish outlook. As of this writing, the indicator stands at 0.057.
An asset’s Elder-Ray Index measures the strength of its bulls and bears in the market. As with ADA, a positive value indicates bullish pressure, suggesting that buyers are dominating and driving prices higher.

Furthermore, ADA’s MACD line (blue) is poised to break above its signal line (orange) at press time. This setup indicates a potential bullish crossover, signaling increasing upward momentum in the asset’s price. It suggests that buying pressure is gaining momentum and is often interpreted as a precursor to a price uptrend.
ADA Price Prediction: Will It Break Out or Pull Back?
ADA is trading at the upper line of its descending triangle at $0.92 as of this writing. Strengthening buying activity suggests a potential breakout above this critical resistance level, which could propel the Cardano price toward a two-year high.

However, a failed attempt to breach the $0.92 resistance could reaffirm the downtrend, erasing ADA’s recent gains. In such a scenario, the price may drop to the $0.84 support level, invalidating the bullish outlook.
The post Cardano’s (ADA) $1.22 Billion Volume May Fuel Rally Toward 2-Year High appeared first on BeInCrypto.
