BNB is down 8% in the last 30 days, but its correction remains notably less severe than those of BTC, ETH, XRP, and SOL. The overall crypto market slumped nearly 10% today, while BNB remains resilient.
Despite the bearish trend, BNB’s ecosystem remains strong. PancakeSwap, its largest DEX, generated more fees in the last seven days than Uniswap and Hyperliquid. In the coming weeks, BNB could break above $586 and target levels near $635 or even $680.
BNB DMI Shows Sellers Are Back In Control
BNB’s Directional Movement Index (DMI) shows that its Average Directional Index (ADX) is currently at 28.5, rising from 22.8 yesterday, signaling that the current trend is strengthening.
ADX measures trend strength but not direction, meaning that whether bullish or bearish, a rising ADX suggests an increase in momentum.
In this case, it remains in a downtrend, and the strengthening ADX indicates that the bearish pressure is becoming more dominant. Unless buying activity picks up, the downward movement could accelerate.
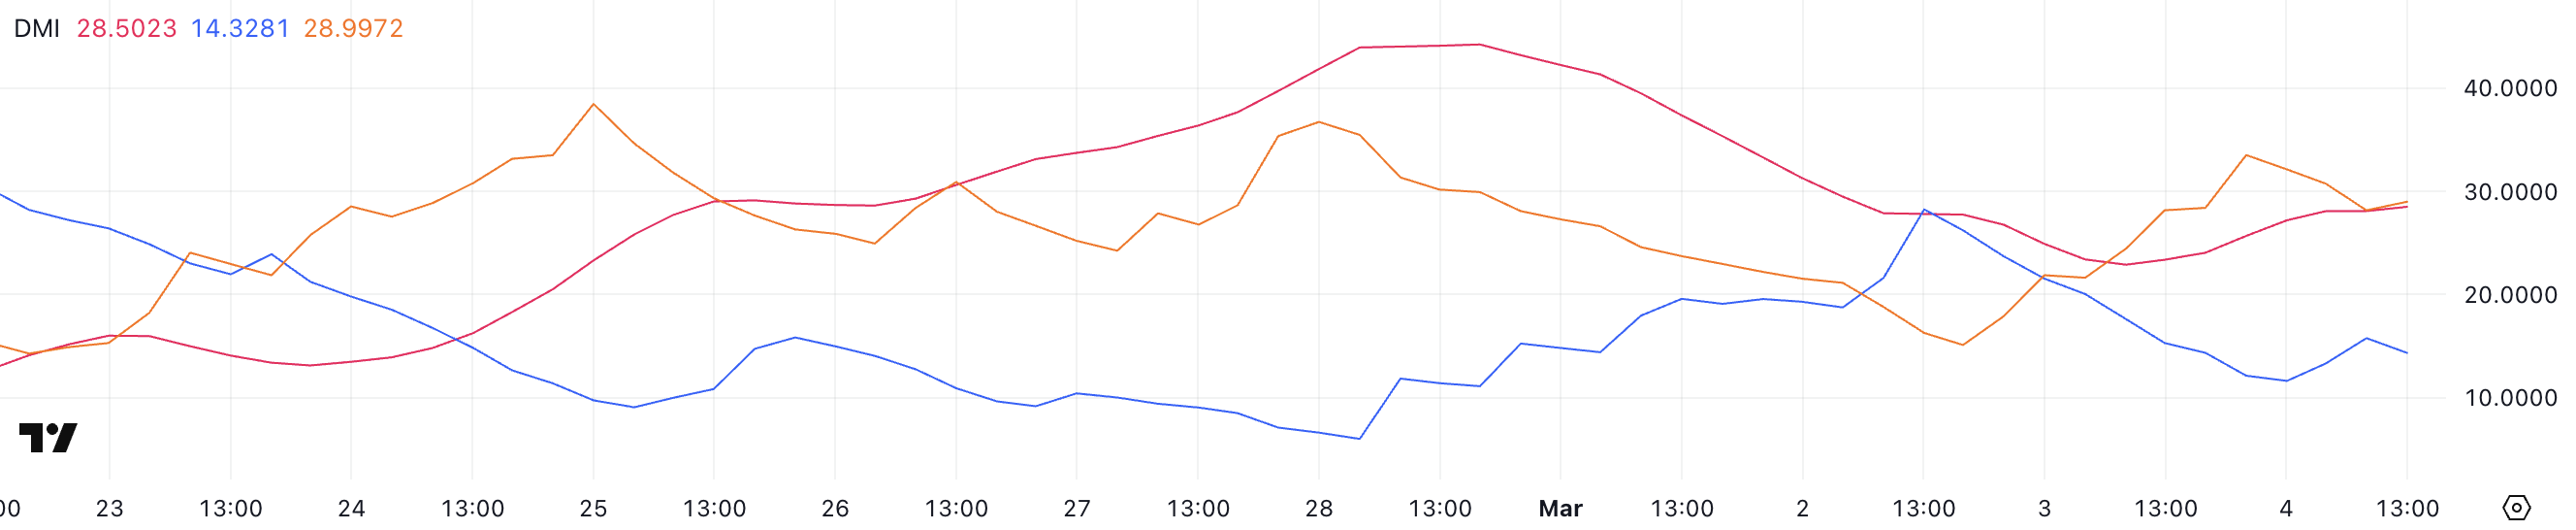
The +DI (Positive Directional Indicator) has dropped to 14.3, down from 28.2 two days ago, signaling that bullish momentum has weakened significantly.
Meanwhile, -DI (Negative Directional Indicator) has surged to 28.99, up from 15 two days ago, confirming that selling pressure is increasing.
With -DI now well above +DI, bears are fully in control, and BNB’s price is likely to remain under pressure. If this trend continues, BNB could face further declines unless bulls step in to reverse the momentum.
Ichimoku Cloud Shows a Bearish Setup For BNB
The Ichimoku Cloud for BNB shows that the price is currently trading well below the cloud, confirming a bearish trend. The sharp decline began after it was rejected from the Tenkan-sen (blue line), which is now sloping downward, reinforcing short-term weakness.
Additionally, the Kijun-sen (red line) remains above the price, signaling that momentum favors the bears. Unless BNB reclaims these key levels, the downtrend could continue in the coming sessions.
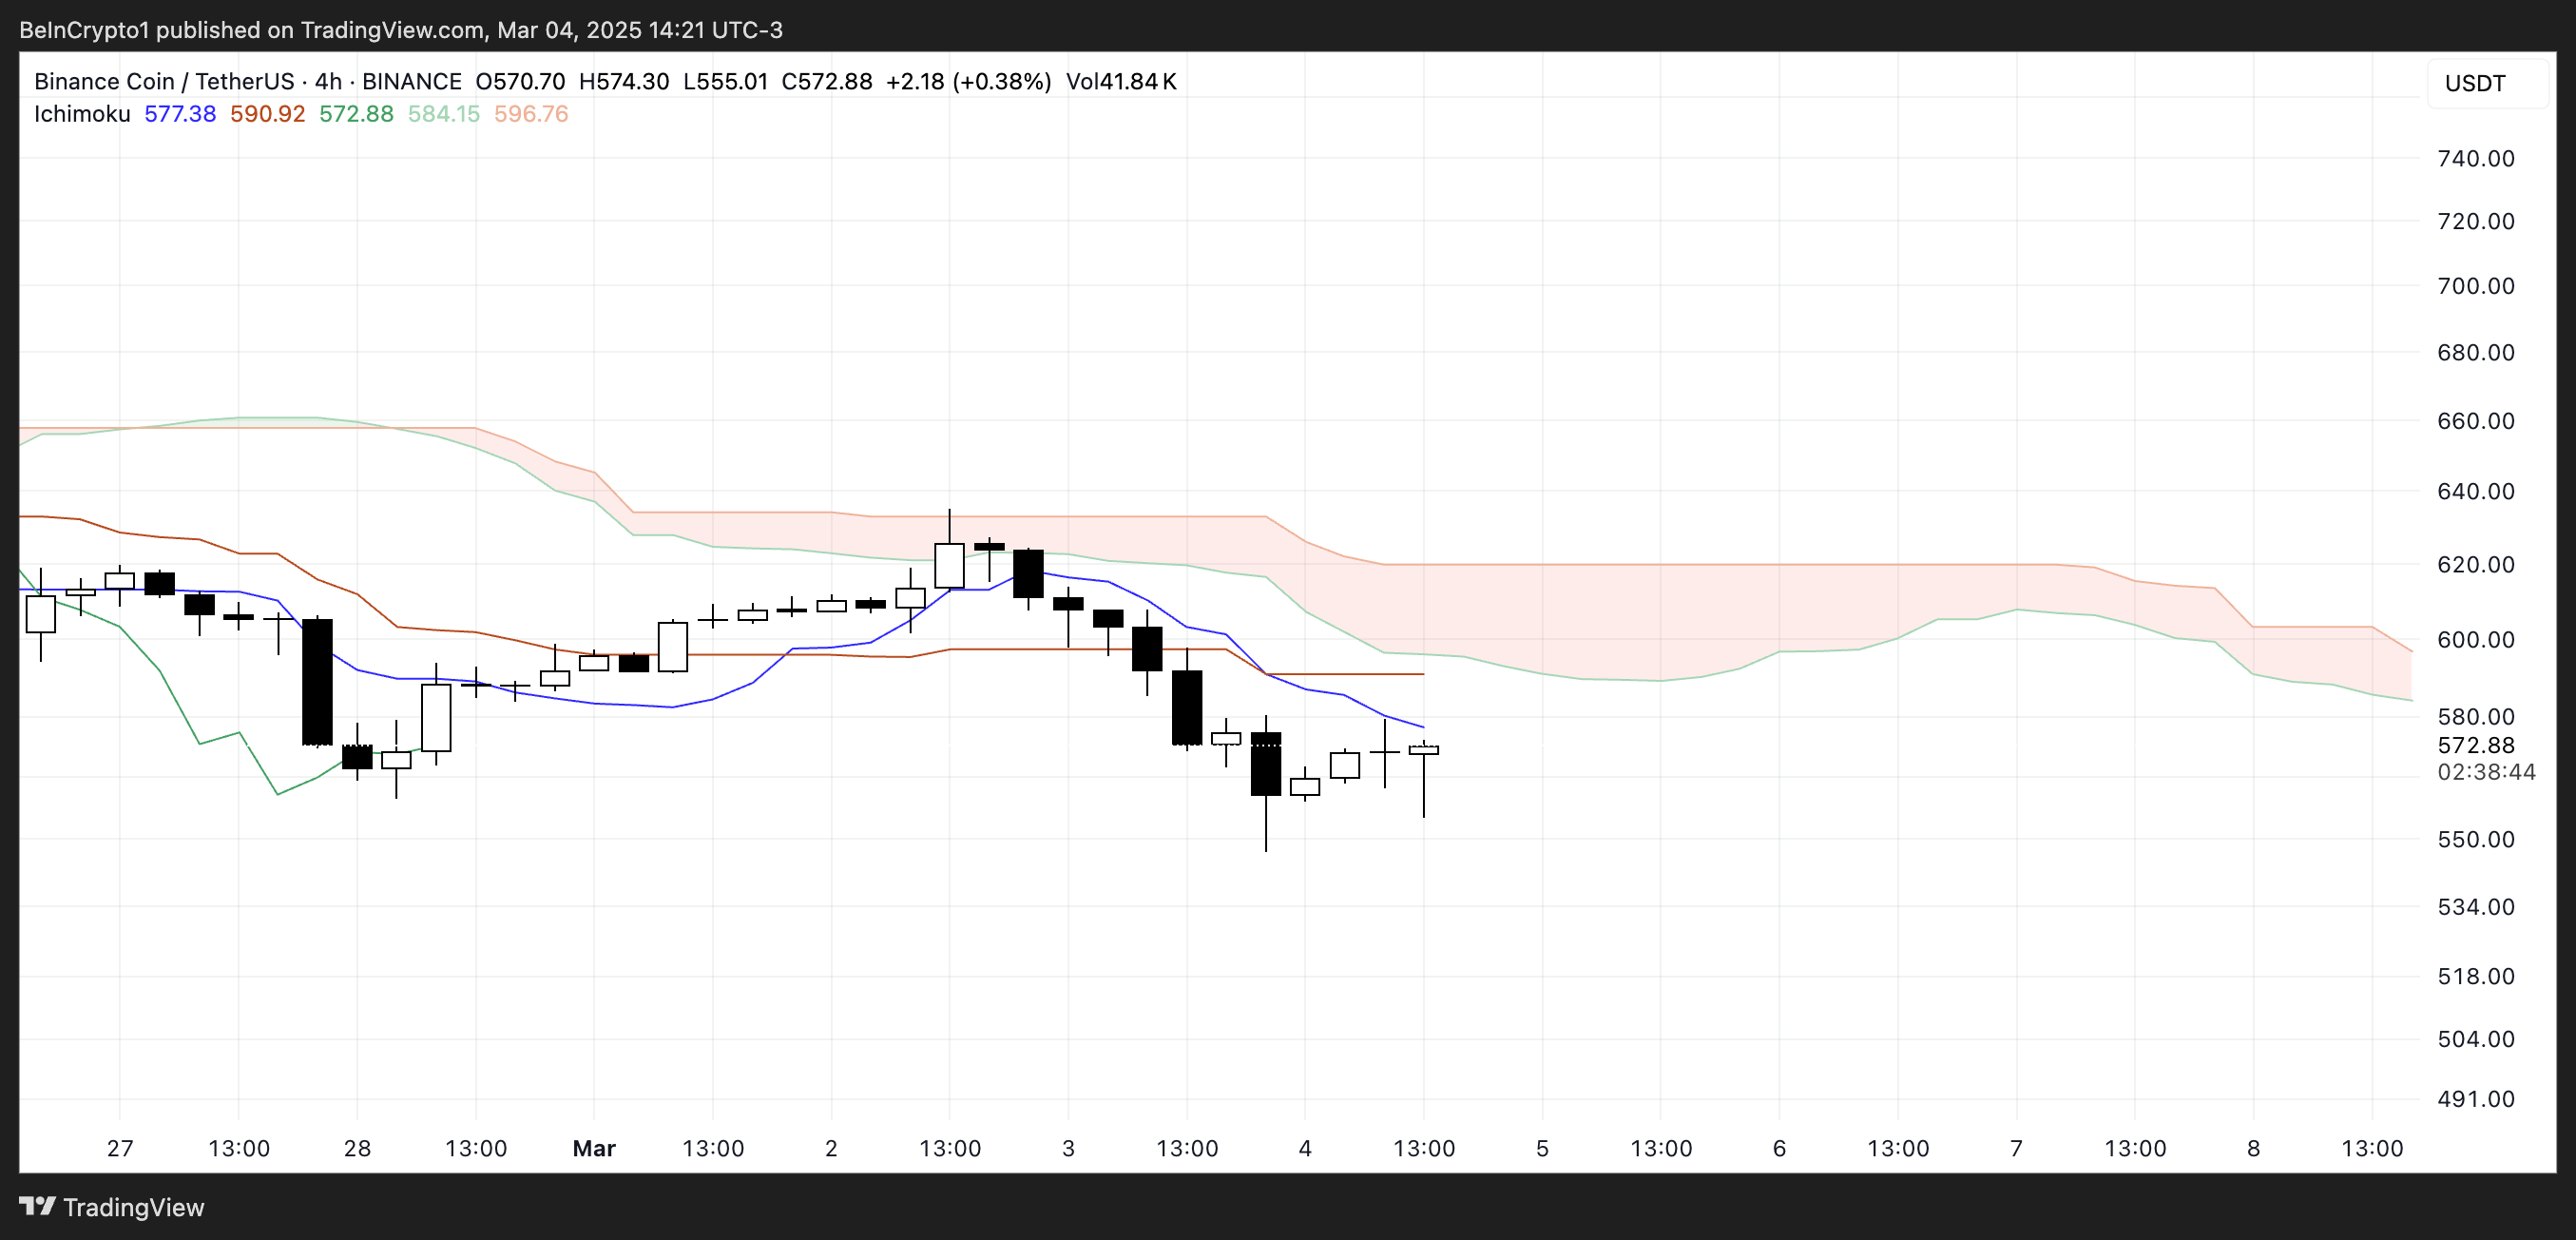
The future cloud remains red, suggesting that bearish conditions may persist. When the price is below the cloud, it indicates a clear downtrend, and a break above it would be necessary to shift momentum bullish again.
For now, BNB faces resistance at the Tenkan-sen and Kijun-sen, and failure to reclaim these levels could lead to further downside. If BNB remains below the cloud, the selling pressure may continue, making it difficult for bulls to regain control.
BNB Is Currently Trading Between Two Important Key Levels
BNB price is currently trading between support at $559 and resistance at $586, with price action consolidating in this range. If the $559 support is tested and lost, BNB could decline further toward $500, a key level.
A break below $500 would be significant, as it would mark the first time it trades below this level since September 2024.
With momentum indicators still favoring the bears, further downside remains a possibility if buying pressure does not increase.
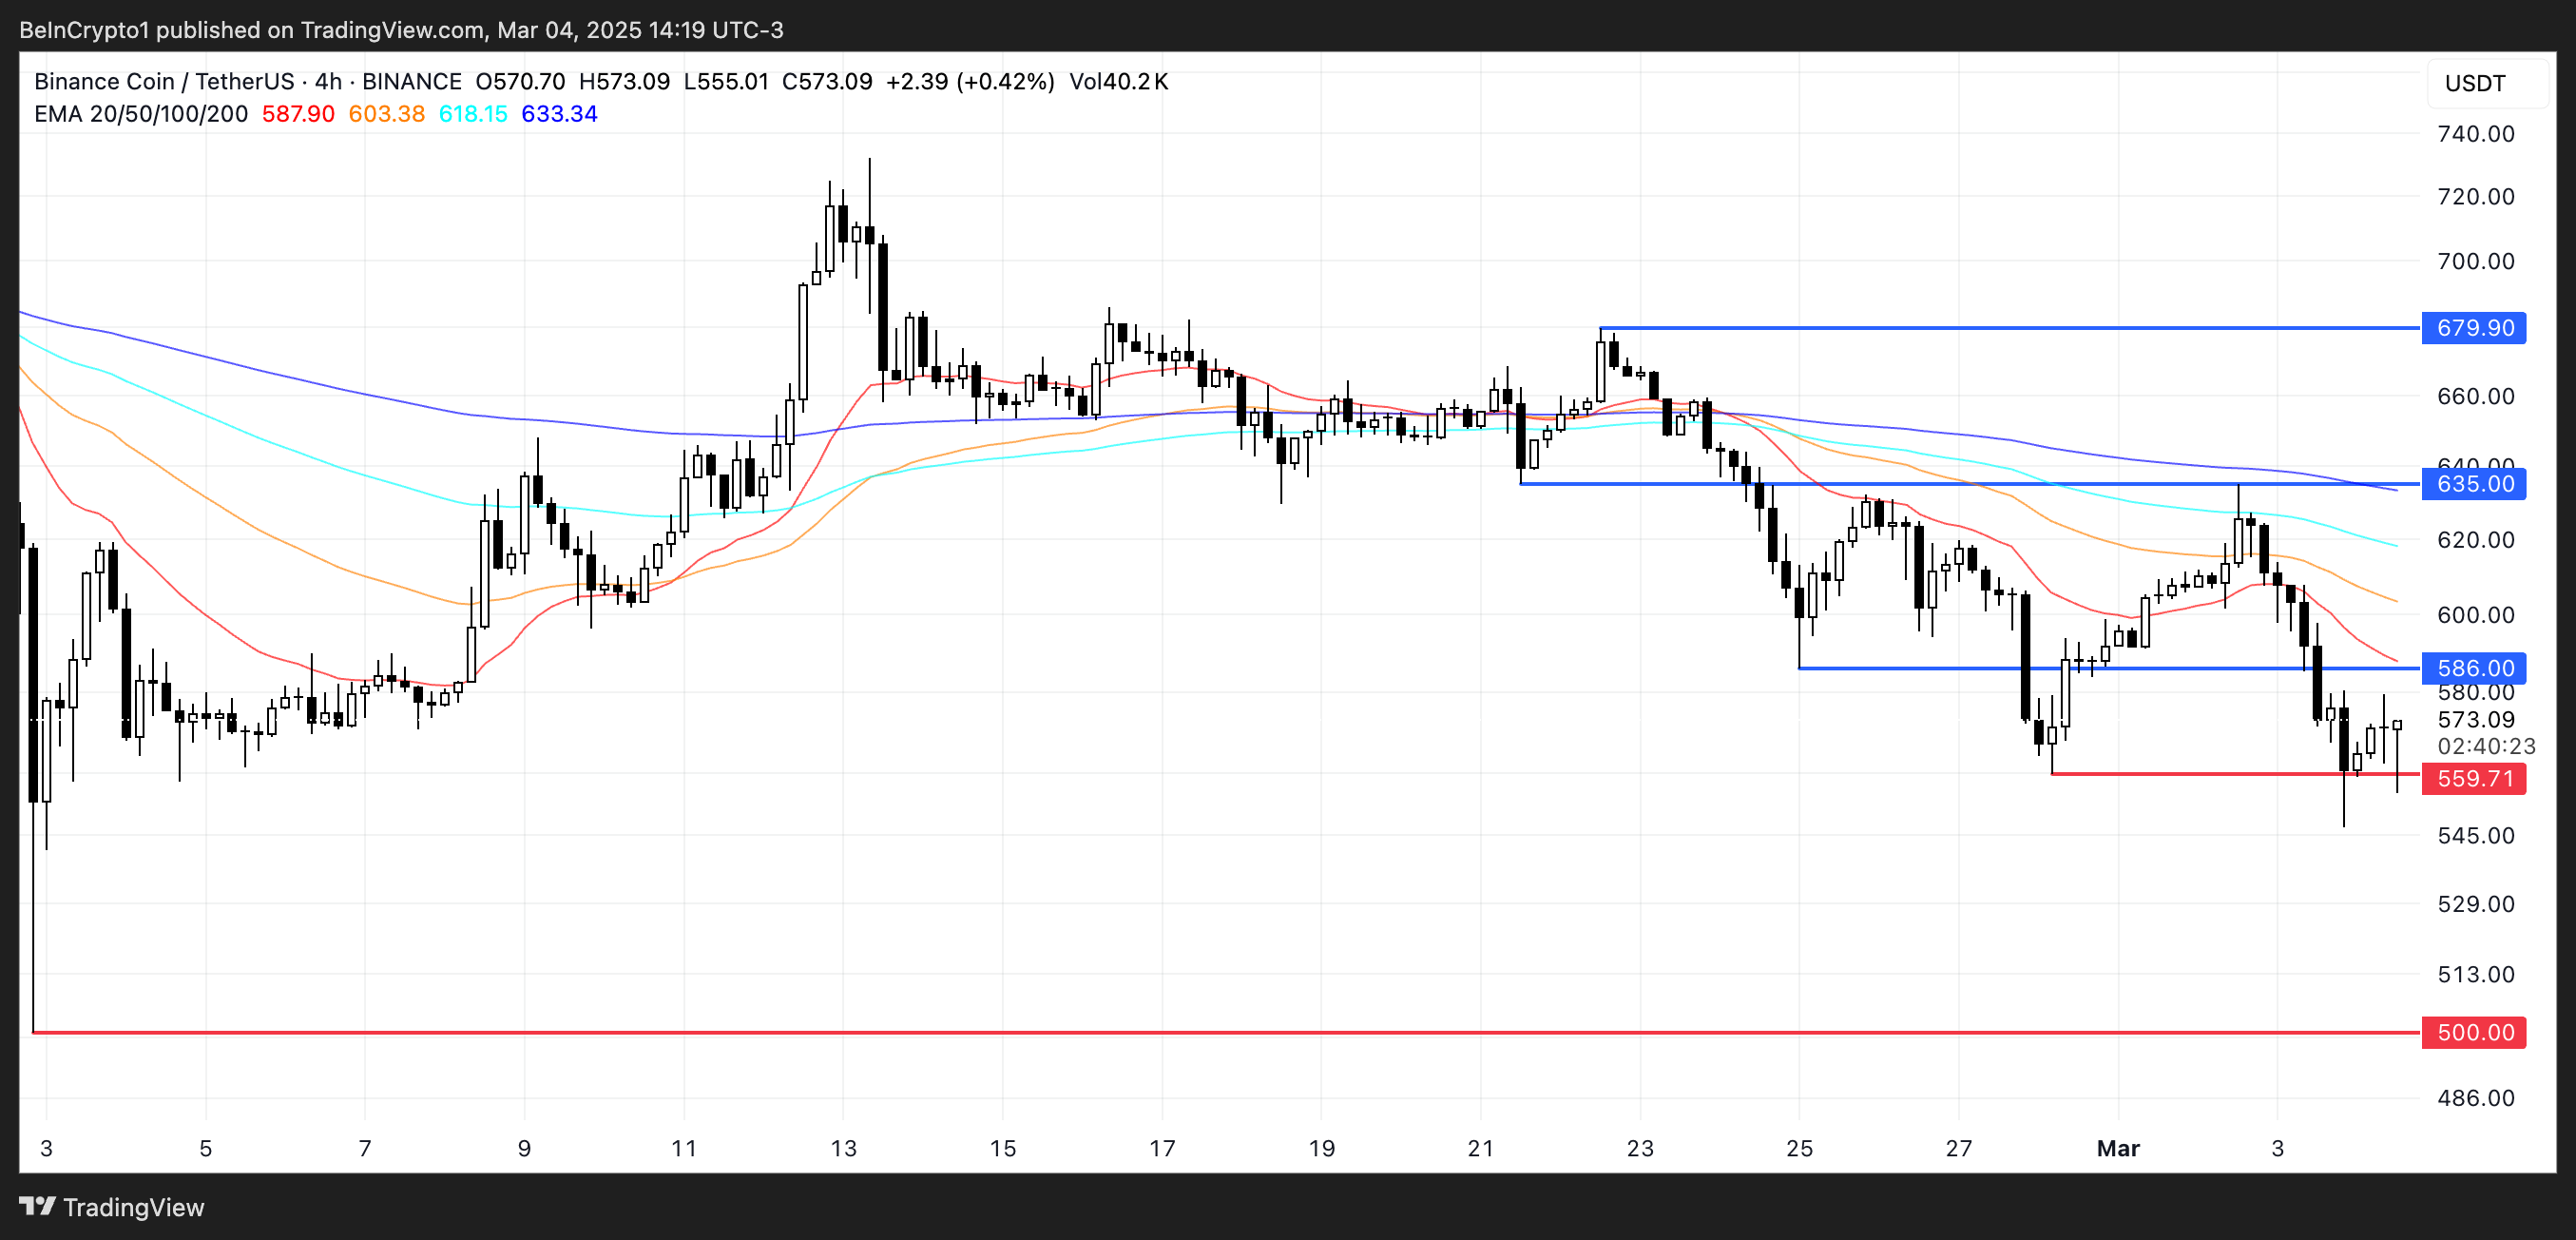
On the other hand, if it can break above $586, it could gain momentum toward the $635 resistance.
A successful move past this level would signal a stronger uptrend, potentially pushing BNB toward $680.
For this scenario to unfold, bulls need to reclaim key resistance levels and reverse the current bearish sentiment. A sustained breakout above $635 would be the first sign of a trend shift.
The post BNB Holds Stronger Than Other Altcoins as Its Ecosystem Continues to Trend appeared first on BeInCrypto.