
Litecoin (LTC) is down more than 12% in the last 24 hours, with its price trading around $100 and its market cap dropping to $7.5 billion. The sharp decline comes as selling pressure intensifies, pushing LTC’s RSI into oversold territory and Chaikin Money Flow (CMF) deeper into negative levels.
If the downtrend continues, LTC could test $92.5 support and potentially drop to $80, its lowest price since November 2024. However, if momentum shifts, LTC could attempt a recovery, breaking back above $100 and targeting resistance levels at $106, $111, and possibly $119.
LTC RSI Is Currently At Oversold Levels
Litecoin Relative Strength Index (RSI) has dropped to 26.7, a sharp decline from 57.1 just two days ago. This steep fall indicates that LTC has entered oversold territory, suggesting intense selling pressure.
Such a rapid drop often reflects panic selling or a strong bearish trend, leaving LTC vulnerable to further downside unless buyers step in.
However, an RSI this low also signals that the asset may be nearing a potential short-term reversal, as oversold conditions often lead to relief bounces.
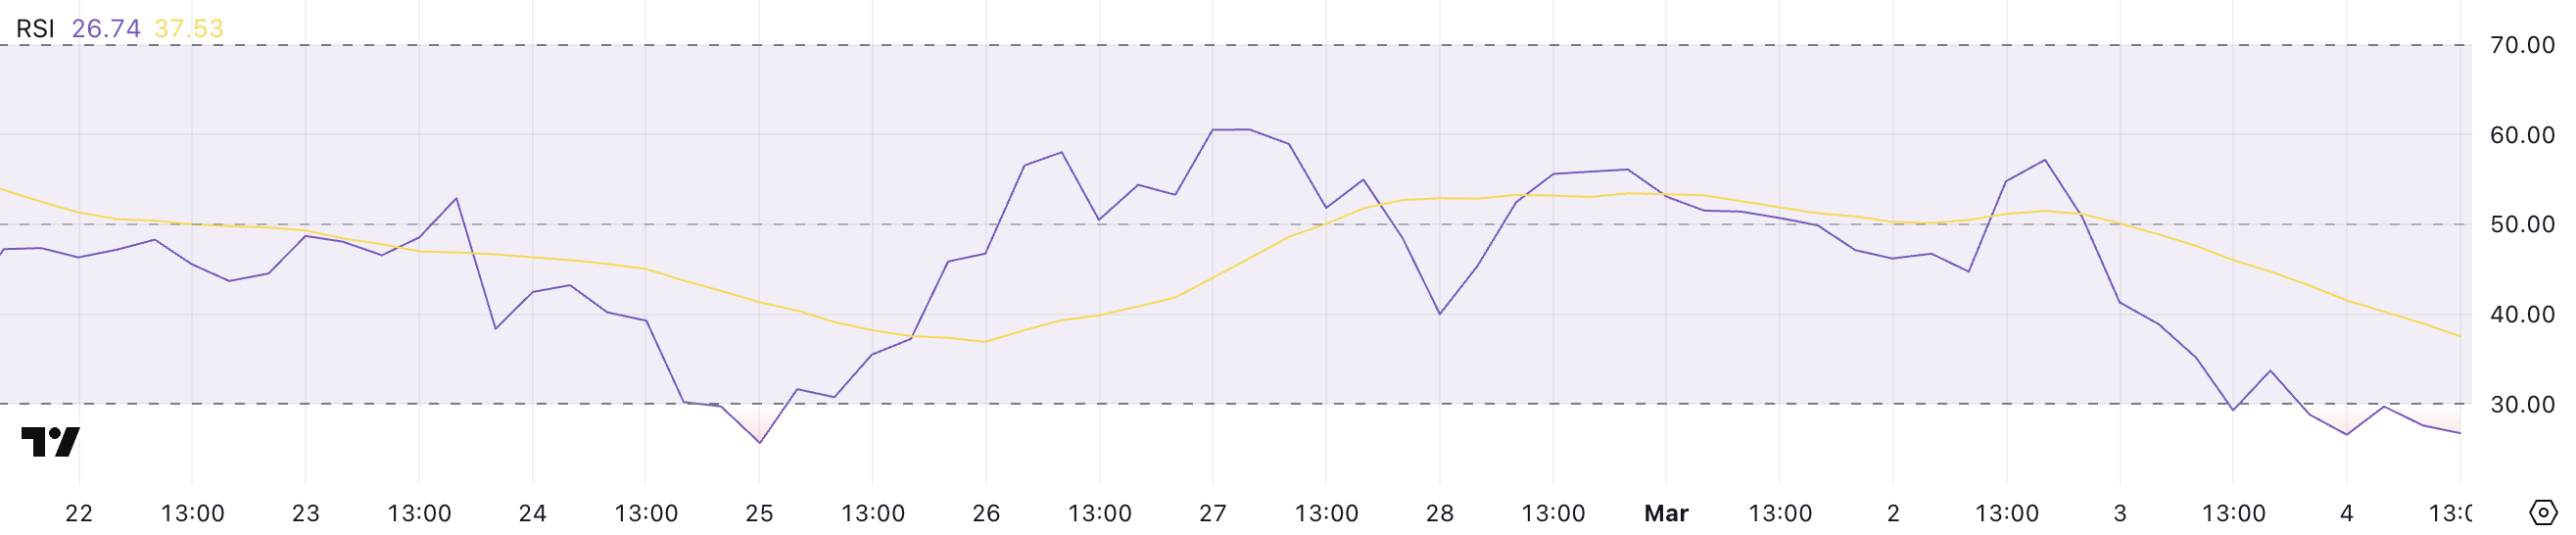
RSI is a momentum indicator that ranges from 0 to 100, measuring the strength of recent price movements. Readings above 70 indicate overbought conditions, where assets are likely to face selling pressure, while readings below 30 suggest oversold conditions, where buying opportunities may emerge.
With LTC’s RSI now at 26.7, it is deep in oversold territory, increasing the chances of a short-term bounce.
However, if bearish momentum persists and RSI continues falling, Litecoin could struggle to find support and extend its losses before any recovery attempt.
Litecoin CMF Fell Below -0.20
Litecoin’s Chaikin Money Flow (CMF) is currently at -0.21, down from 0.03 just two days ago, indicating a significant shift in capital flow. Earlier, CMF briefly dropped to -0.26, its lowest level since mid-February, reinforcing bearish sentiment.
A declining CMF suggests that selling pressure is increasing, with more capital flowing out of LTC than into it.
This trend signals that investors are pulling liquidity from Litecoin, making it difficult for the price to sustain any short-term rebounds.
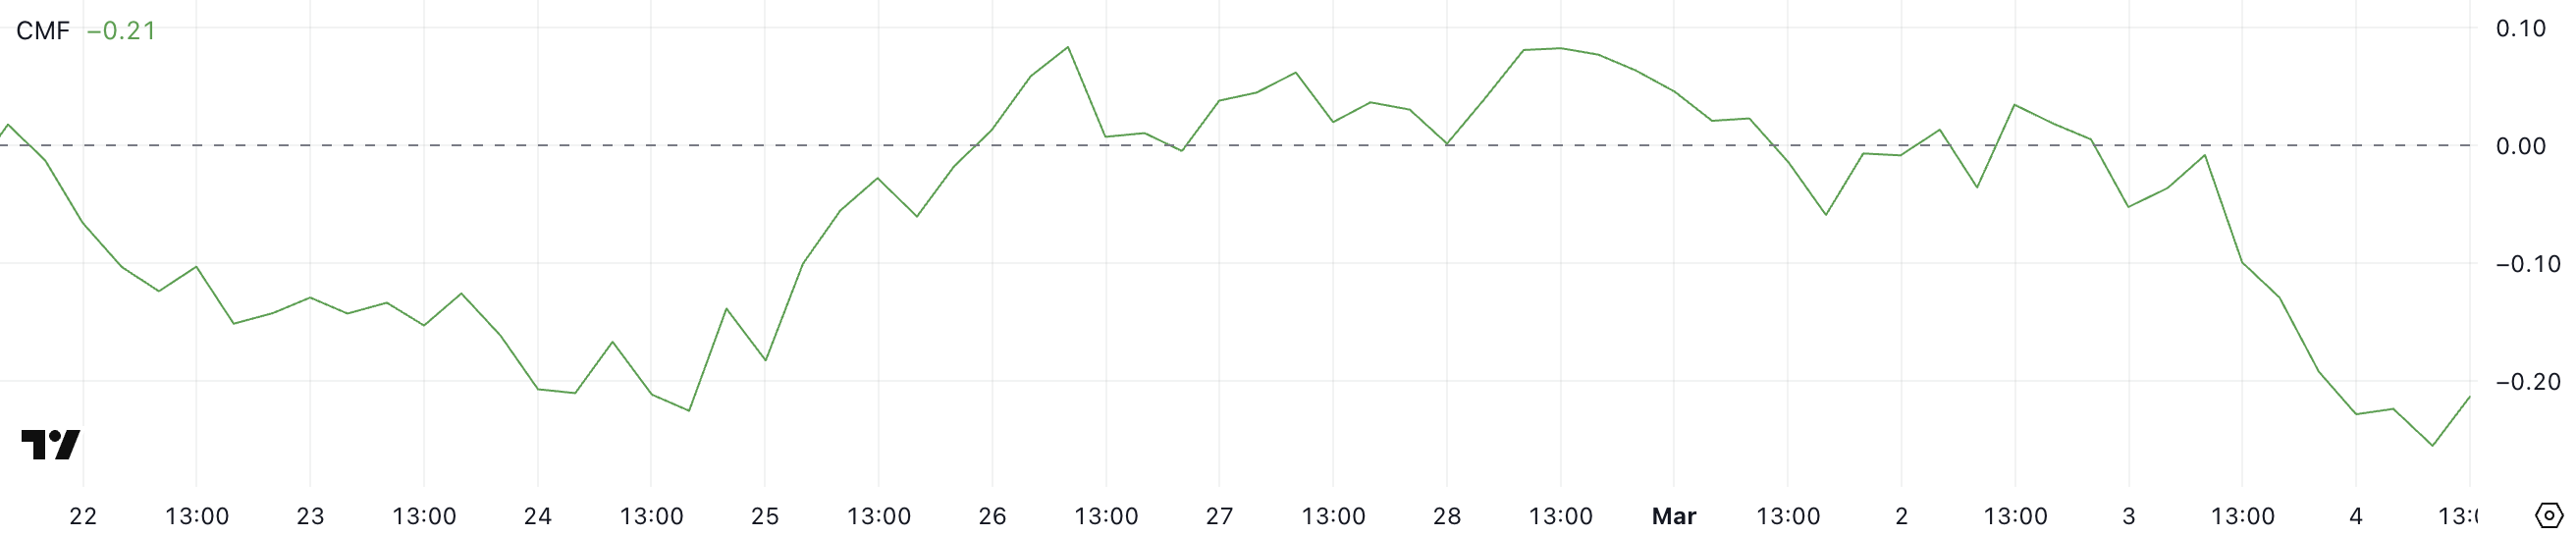
CMF measures buying and selling pressure by analyzing volume and price movements ranging from -1 to 1. Positive values indicate accumulation, meaning more money is flowing into an asset, while negative values suggest distribution and increased selling pressure.
With LTC’s CMF now at -0.21, sellers remain in control, and unless buying volume returns, LTC could struggle to find support.
The recent drop to -0.26 shows that capital outflows are reaching extreme levels, increasing the risk of further downside unless sentiment shifts.
Will Litecoin Fall Below $90 Soon?
If Litecoin’s downtrend continues, the price could test the $92.5 support level, a key zone that has previously held buyers. If this level is lost, LTC could drop as low as $80, marking its lowest price since November 2024.
With momentum indicators like RSI and CMF showing bearish pressure, further declines remain a possibility unless buyers step in to defend support.
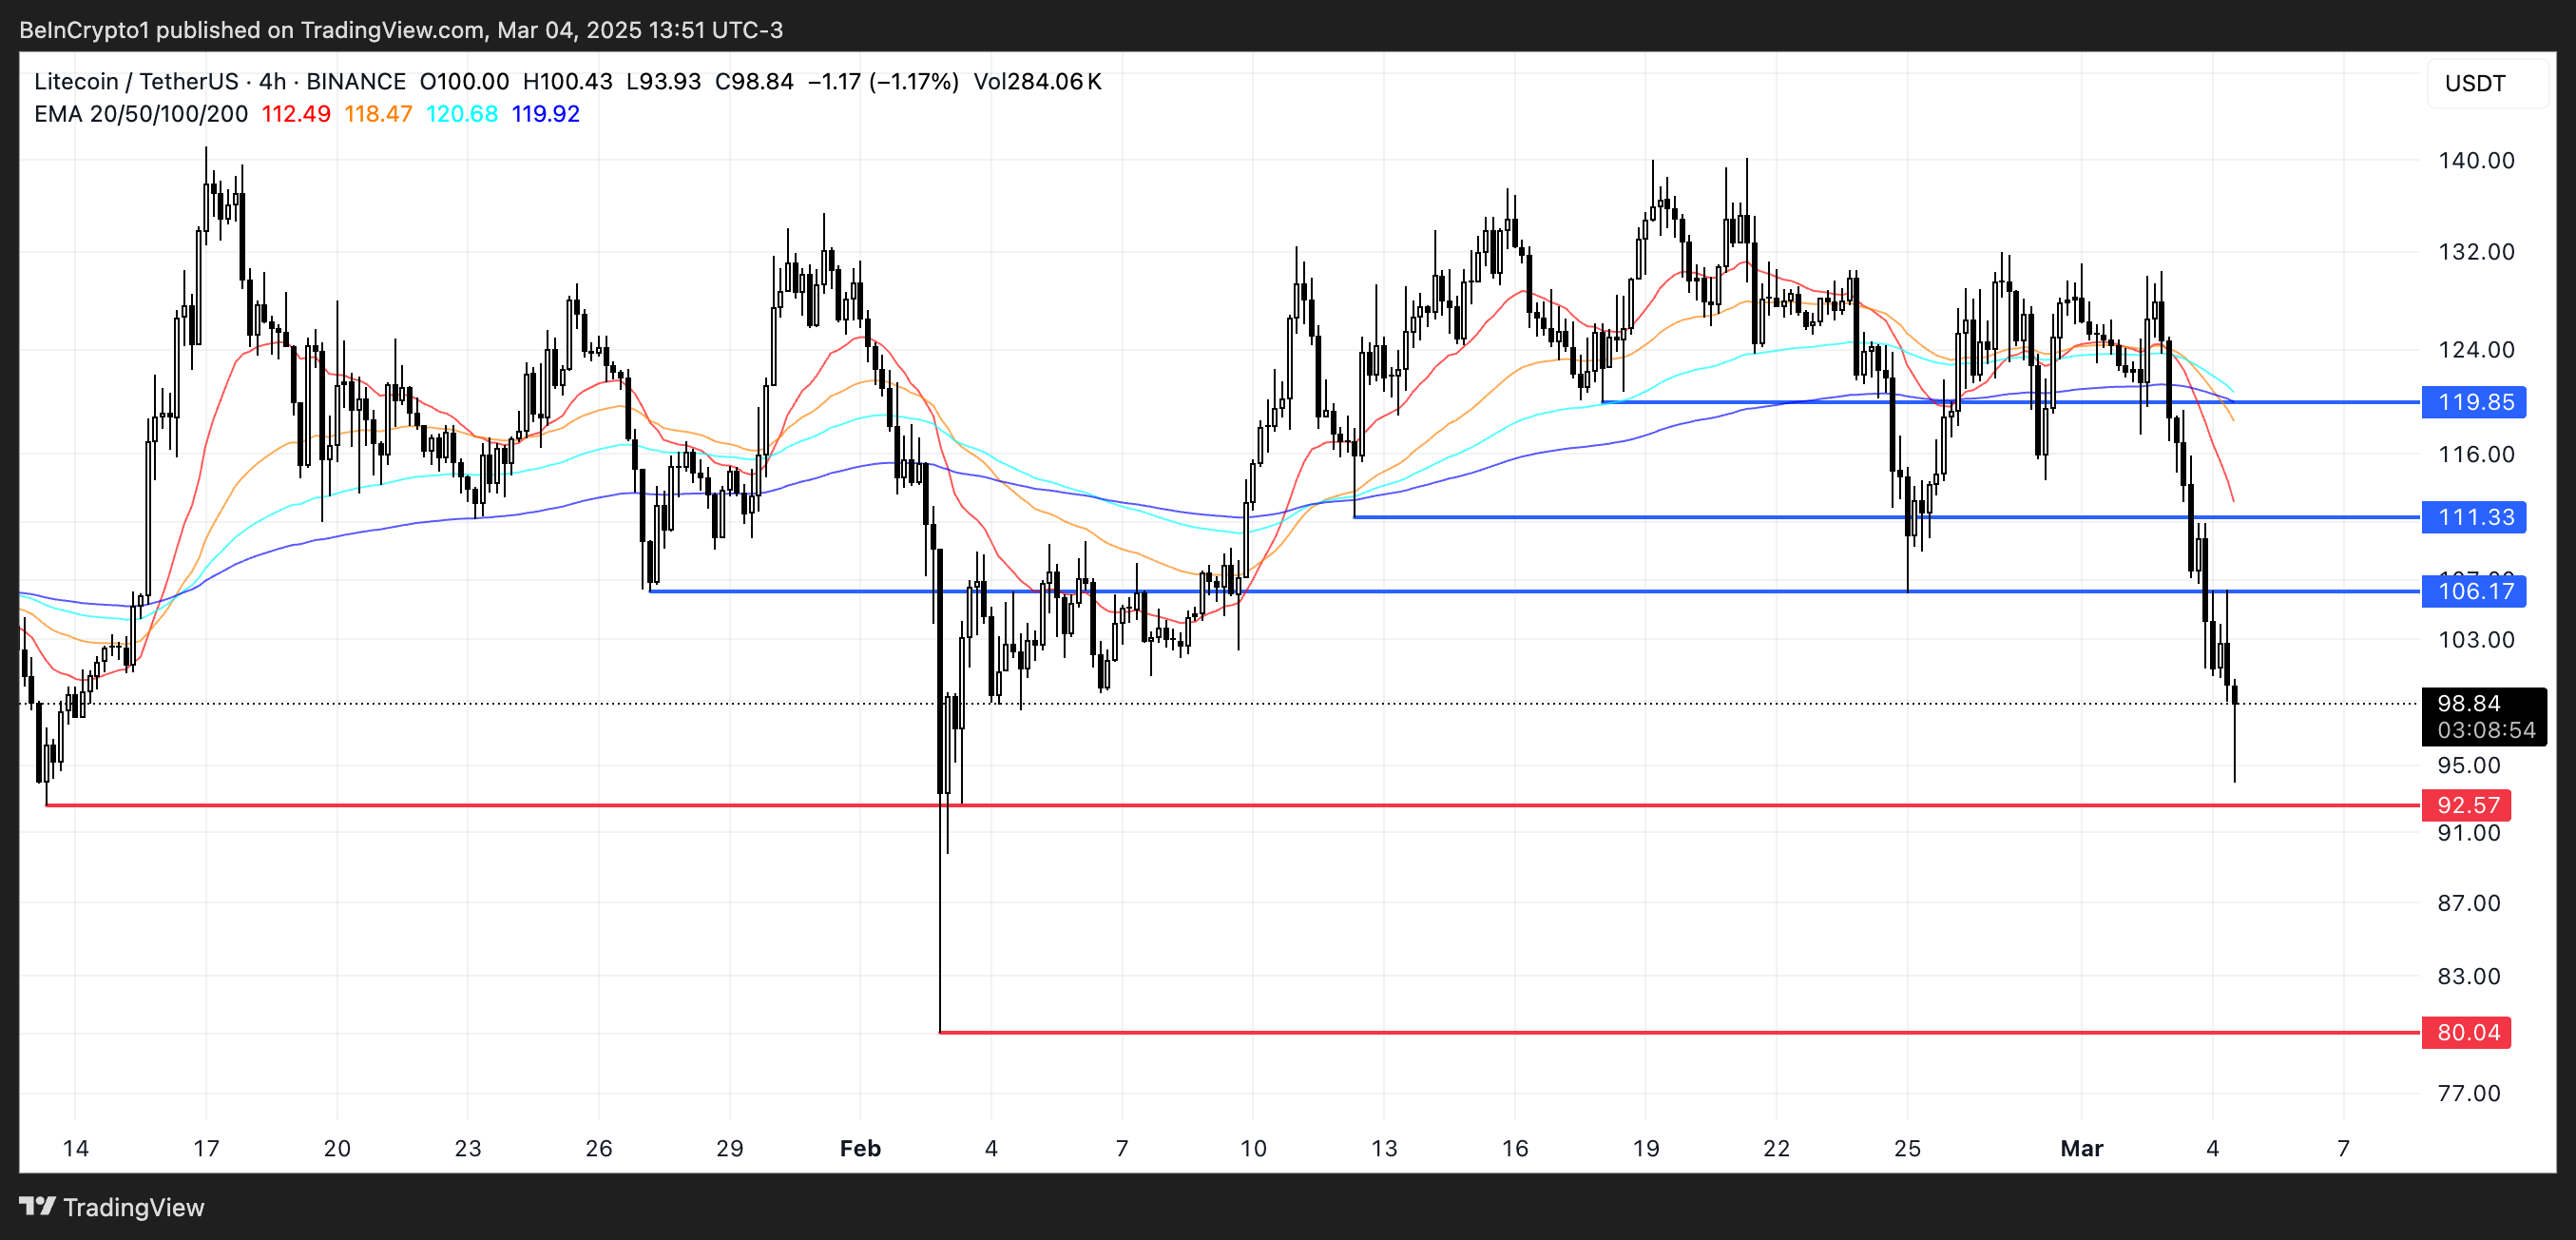
However, if LTC reverses its trend, it could regain momentum and push above $100, with $106 as the first major resistance level.
A breakout above this could lead to a test of $111, and if bullish momentum strengthens, LTC could rally toward $119.
The post Litecoin (LTC) Falls 12% as Indicators Suggest Oversold Conditions appeared first on BeInCrypto.