
SafeMoon (SFM) has surged nearly 60% in the last two days and 490% in the past week following its migration from BNB to Solana. The rapid price increase has pushed key indicators into bullish territory, with ADX confirming strong trend momentum and EMA lines forming a golden cross.
However, BBTrend remains in negative territory despite briefly turning positive, signaling that selling pressure still lingers. If the uptrend fails to hold, SFM could face a sharp correction, potentially losing up to 55% from its recent highs.
SafeMoon ADX Shows the Uptrend Is Strong
SafeMoon’s Average Directional Index (ADX) is currently at 31.5, a significant rise from 17.7 just a day ago. This sharp increase suggests that trend strength has dramatically improved, reinforcing the possibility of a more defined directional move at a moment when meme coins are having a hard time.
With ADX now above the key 25 threshold, it signals that SafeMoon is transitioning from a weak trend into a stronger phase.
Given that SFM is attempting to establish an uptrend, the rising ADX indicates growing momentum, potentially supporting further price increases if buying pressure continues to build.
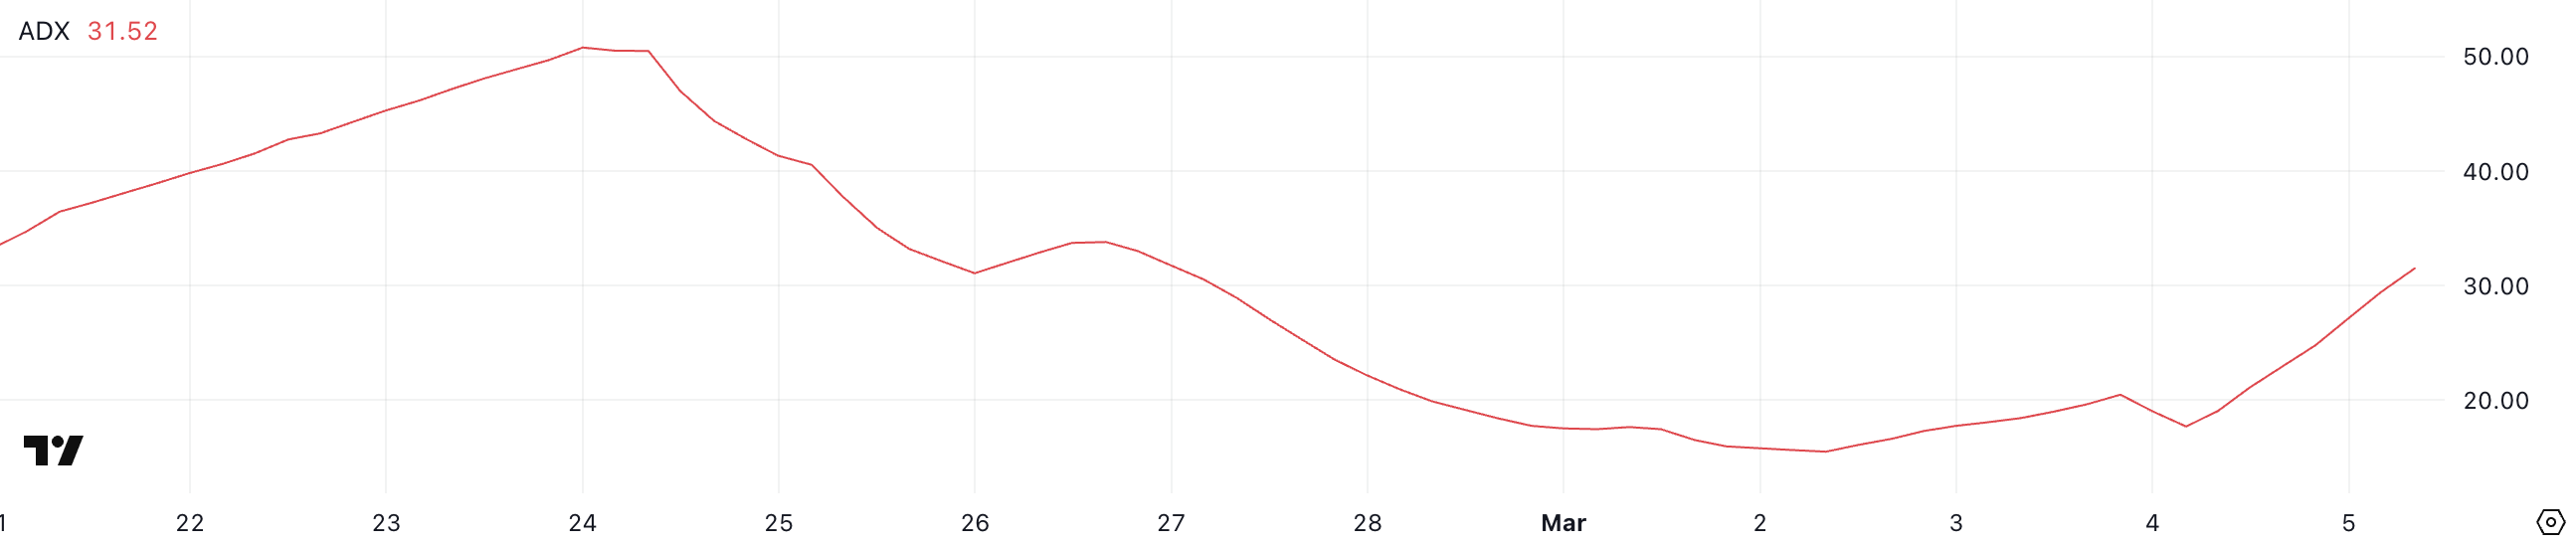
ADX, or the Average Directional Index, is a technical indicator that measures the strength of a trend without determining its direction.
Generally, values above 25 indicate a strong trend, while readings below 20 suggest weak or indecisive market conditions. With SFM’s ADX now at 31.5, it confirms that momentum is strengthening, supporting the case for a sustained move higher. However, while ADX shows trend strength, the direction will depend on whether buying pressure remains dominant.
If bullish sentiment continues, SFM could solidify its uptrend, but if selling pressure returns, price action could become more volatile despite the rising ADX.
SFM BBTrend Briefly Touched Positive Levels, But It’s Negative Again
SFM Bollinger Band Trend (BBTrend) is currently at -6.54, after briefly touching a positive value of 4.88 yesterday. However, this bullish move was short-lived, and SFM’s BBTrend has remained in negative territory since February 26.
The trend reached its lowest point at -58.3 on March 2, signaling extreme bearish momentum at the time.
While the current level is a significant improvement from this recent low, the fact that SFM was unable to sustain a positive BBTrend suggests that selling pressure remains a dominant force in the market, despite the current price surge.
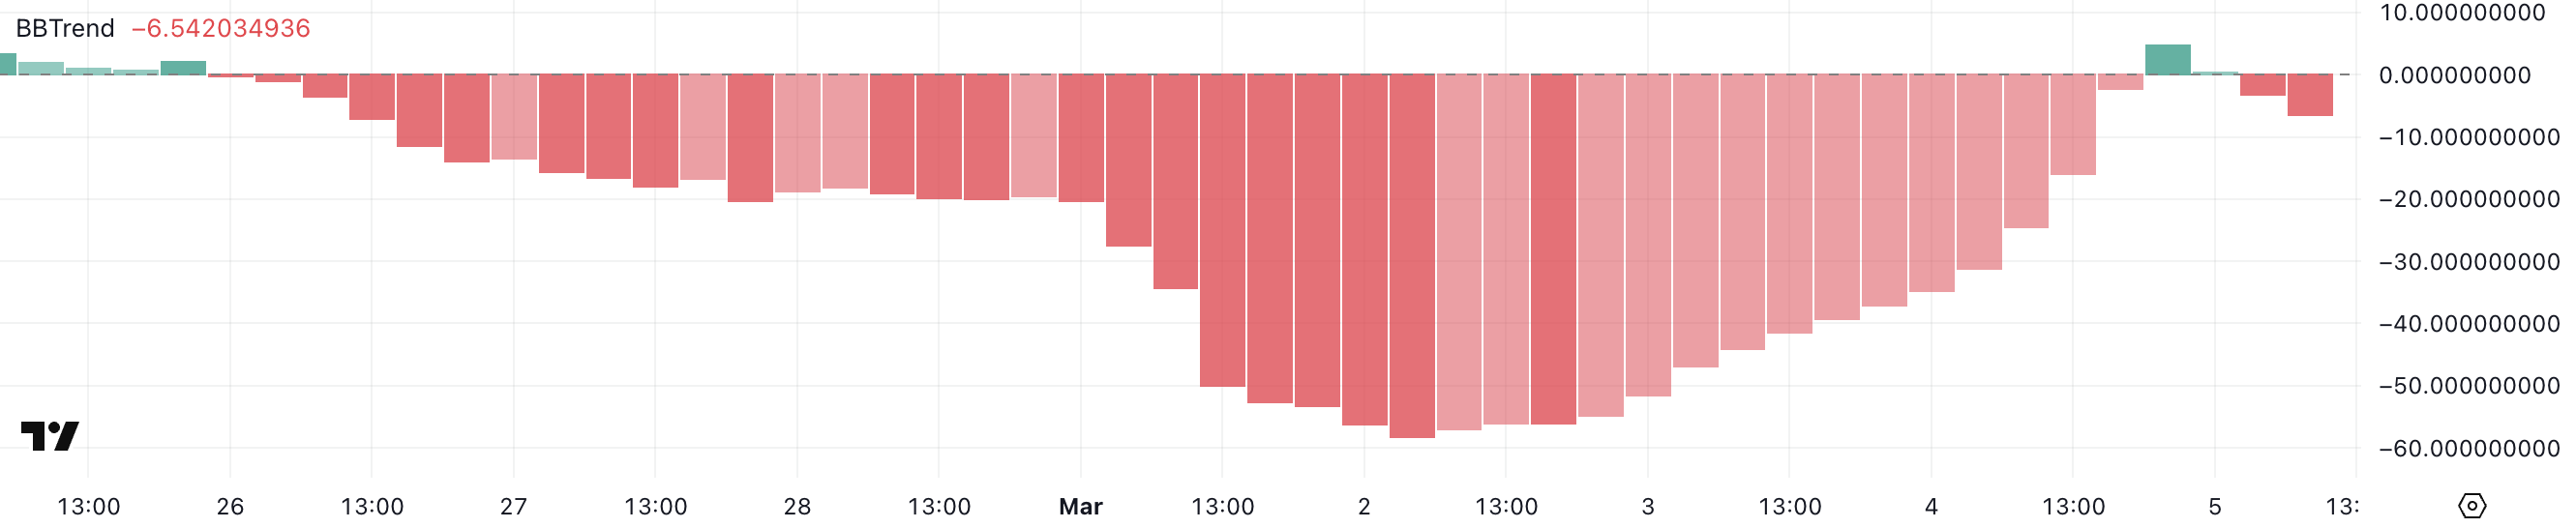
BBTrend, or Bollinger Band Trend, is a technical indicator used to assess the strength and direction of price movement based on Bollinger Bands. Positive values indicate that the price is trading in the upper portion of the bands, signaling bullish momentum.
In contrast, negative values suggest that the price is within the lower bands, reflecting a bearish trend. With SFM BBTrend now at -6.54, it indicates that while the extreme bearish conditions from March 2 have eased, the asset is still in a negative phase.
If BBTrend moves back into positive territory and holds, it could signal a shift toward a stronger recovery, but if it continues to trend downward, it would confirm that SFM remains under selling pressure.
SafeMoon Could Correct By 55% Soon
SafeMoon EMA lines are currently forming a golden cross, a bullish signal that often precedes upward momentum. A golden cross occurs when a shorter-term EMA crosses above a longer-term EMA, indicating a shift toward bullish market conditions.
SafeMoon is trending after its recent migration from BNB to Solana. If this trend holds, SFM could rise to test the resistance at $0.000128. A successful breakout above this level could push the price further toward $0.000134.
This formation suggests that bullish momentum is building, potentially setting the stage for a stronger recovery if buyers sustain their pressure.
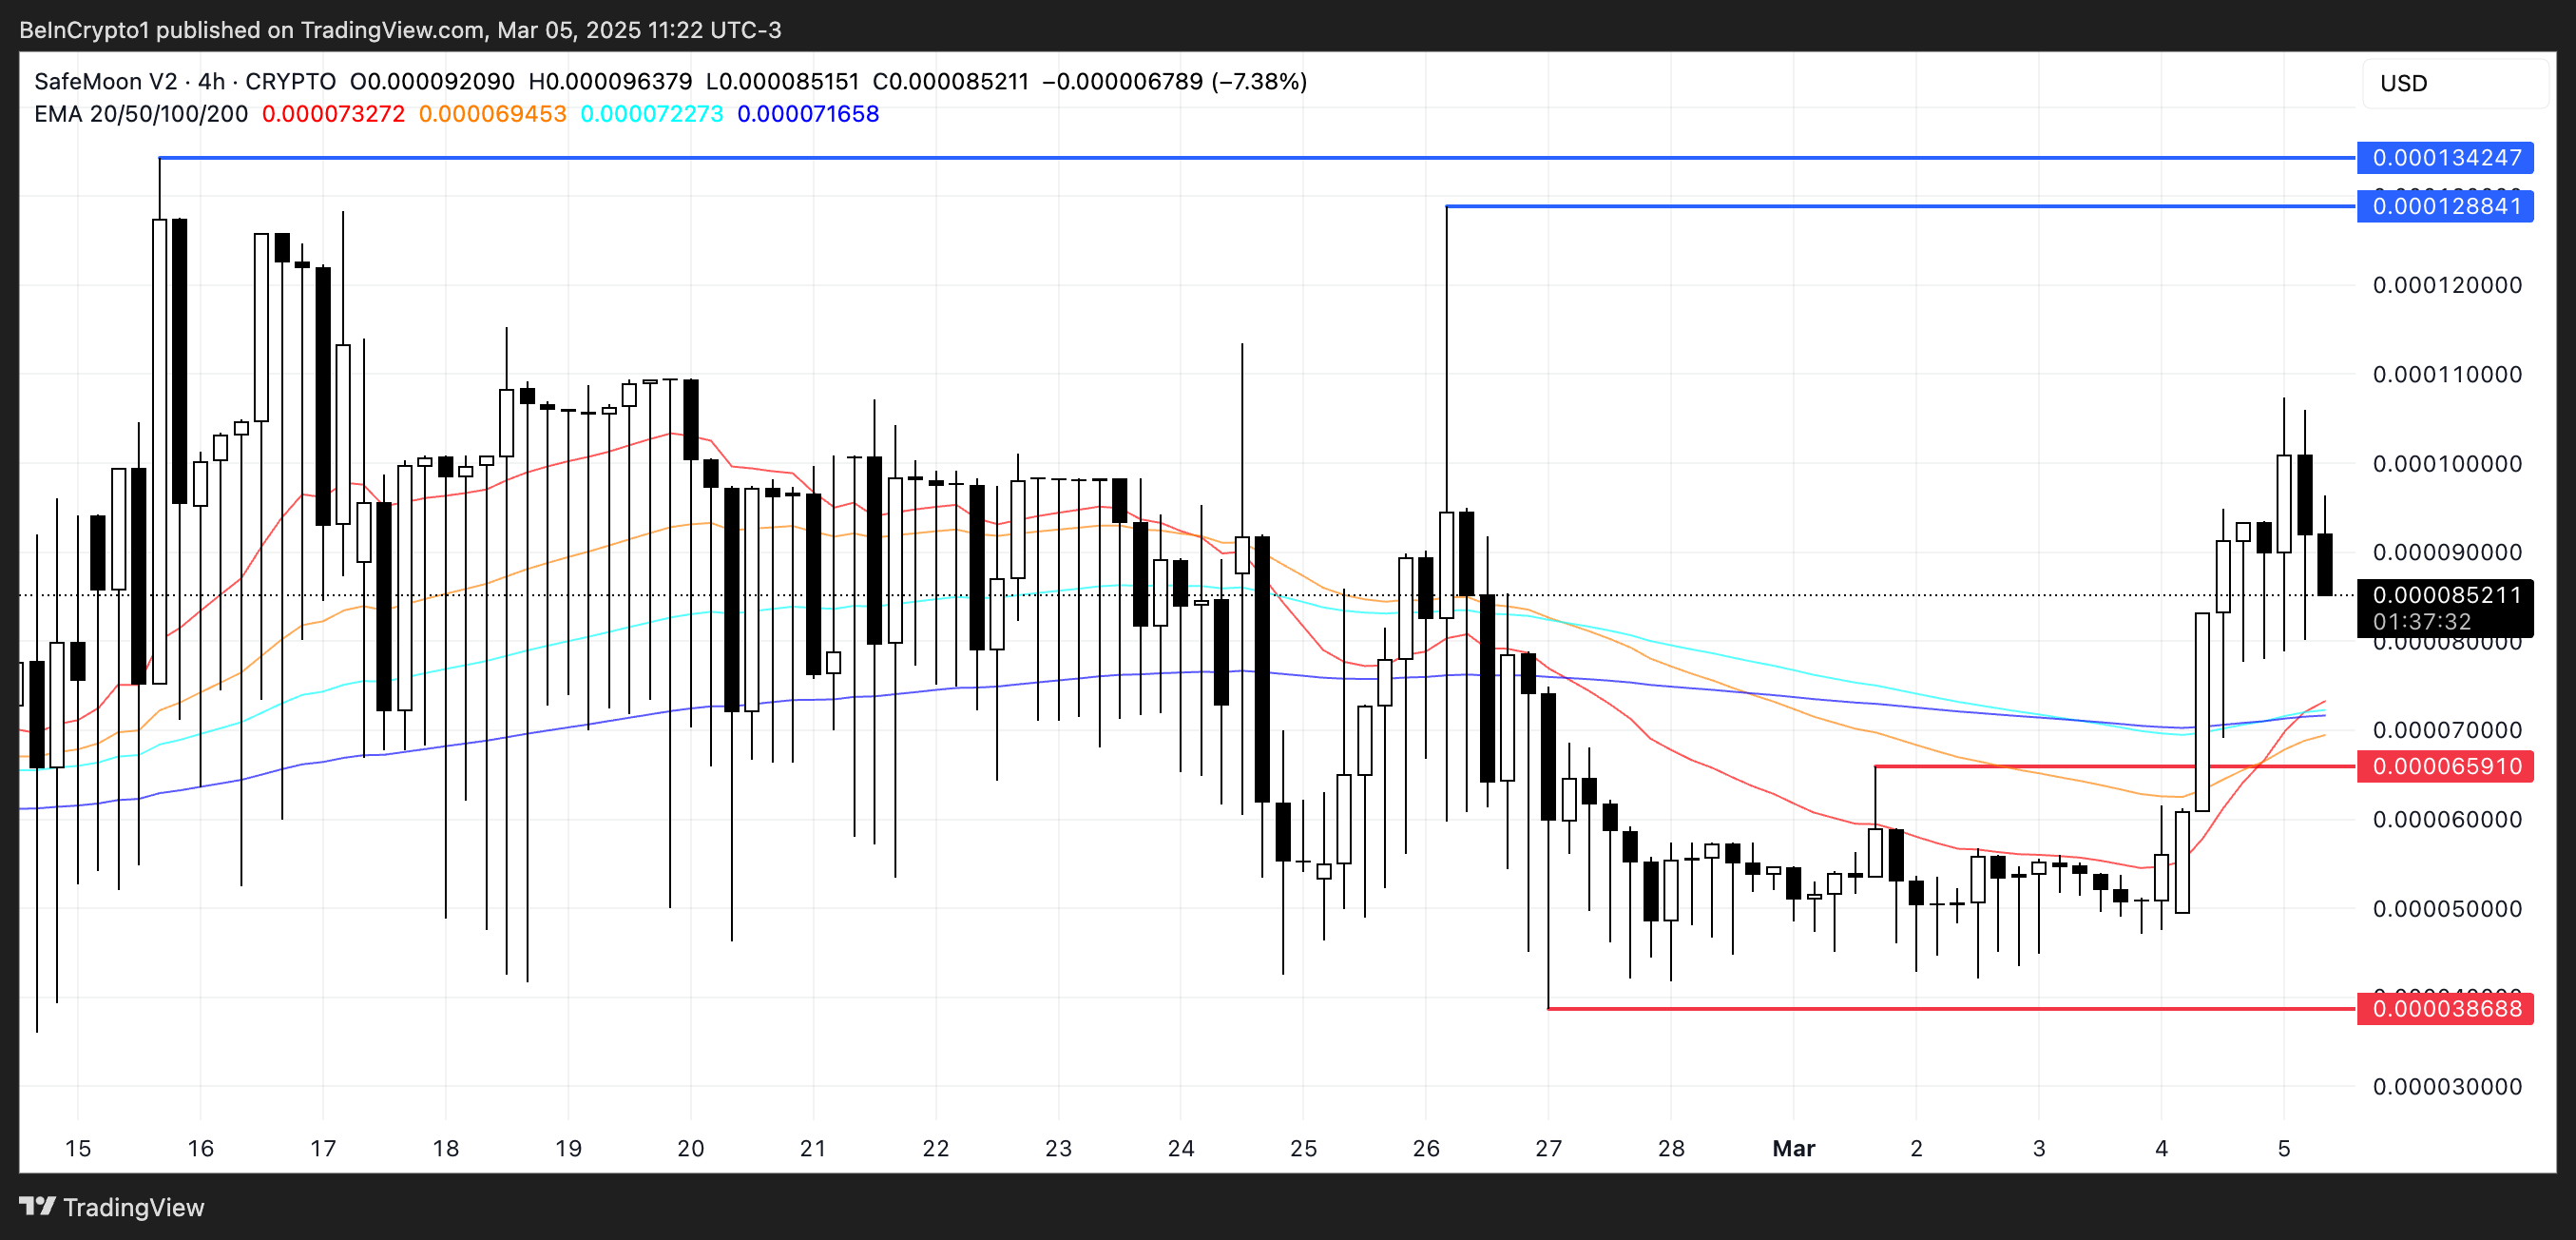
However, as indicated by BBTrend, the uptrend remains fragile and could quickly reverse into a strong correction.
If bullish momentum fades and selling pressure increases, SFM could drop to test support at $0.0000659.
A breakdown of this level could accelerate the decline, pushing the price as low as $0.000038.
The post SafeMoon (SFM) Holds Gains After Solana Migration, But Could Drop 55% appeared first on BeInCrypto.