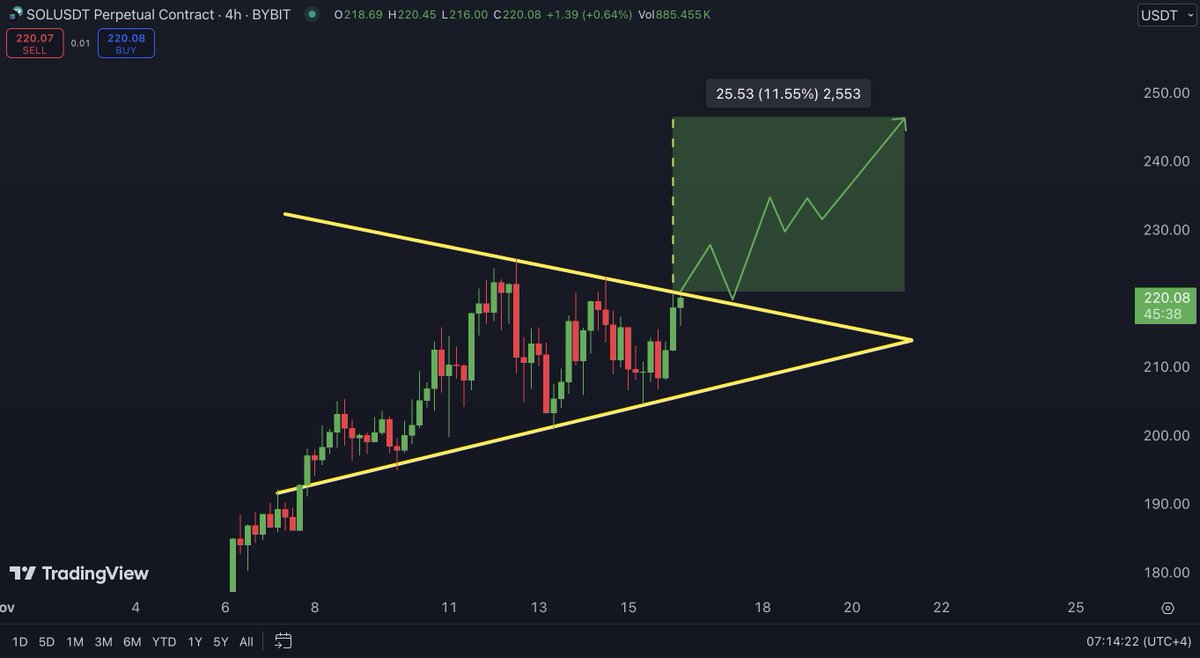
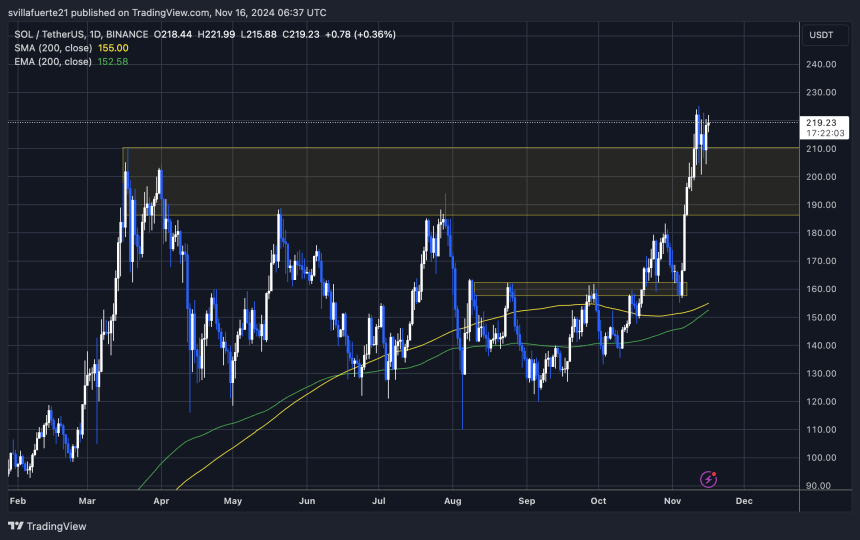
Solana has experienced a turbulent few days, with its price fluctuating between yearly highs at $225 and local lows at $200. This volatility has sparked significant interest among traders and investors as Solana tests key levels critical to its next move.
Top analyst and macro investor Carl Runefelt has weighed in with a technical analysis, suggesting that a decisive break above the $225 resistance level could ignite a rally toward $246. According to Rubefelt, this level represents a pivotal threshold, and surpassing it may lead to accelerated bullish momentum.
The broader crypto market adds another layer of intrigue, with Bitcoin once again nearing its all-time high. Historically, Bitcoin’s movements have fueled market-wide rallies, and its current trajectory could provide the momentum needed for Solana to break out of its range and achieve new highs.
As traders closely monitor both Solana’s and Bitcoin’s price action, the coming days will likely set the tone for the next chapter in this bullish cycle. Will Solana leverage market strength to surge past $225, or will resistance hold, leading to further consolidation? The unfolding narrative promises to be crucial for altcoin enthusiasts and market participants alike.
Solana Testing Crucial Supply
Solana is consolidating below critical supply levels that could act as a launchpad for testing its all-time high at $258. Currently trading in a tight range, Solana’s price action reflects indecision as traders and investors anticipate the next big move.
According to key analyst Runefelt, the altcoin is positioned for a breakout. Sharing his technical analysis on X, Runefelt outlined a potential 12% surge, targeting the $246 resistance level—a crucial hurdle before Solana can challenge its historical peak.

Breaking above this level would signal strong bullish momentum and likely set the stage for a rally to new all-time highs. However, for this scenario to play out, Solana must not only breach current levels but also hold them as support. Consolidation above these key thresholds would reinforce confidence among market participants and attract more demand, further fueling upward momentum.
The broader market’s movements, particularly Bitcoin nearing its all-time highs, add another layer of significance. If Bitcoin sustains its bullish trajectory, it could provide the necessary tailwind for Solana to break through its consolidation phase.
The coming days will be crucial in determining Solana’s direction. A breakout to the upside could solidify its place as a leading altcoin this cycle, while failure to hold above current levels might delay the rally.
Key Levels To Watch
Solana (SOL) is currently trading at $219 after four days of sideways consolidation just below the critical $225 resistance level. This consolidation reflects a market waiting for a decisive breakout as traders eye the next move. Holding above the $200 demand level remains essential for confirming the bullish outlook. This support has acted as a foundation for Solana’s recent uptrend, and a failure to maintain it could signal weakness and open the door for further downside.

Breaking and holding above the $225 resistance, however, is pivotal to affirm Solana’s bullish trend. This level serves as a psychological barrier and the bears’ last stronghold, with many likely to take profits or initiate shorts. If Solana can overcome this resistance, it could set the stage for an aggressive rally to all-time highs, effectively ending selling pressure.
A decisive breakout above $225 would not only signal bullish strength but also create a domino effect, attracting new buyers and fueling momentum. Such a move could lead to a sharp climb, putting SOL on track to challenge its $258 all-time high and potentially set new records. In the coming days, all eyes will be on Solana’s ability to reclaim key levels and build on its bullish momentum.
Featured image from Dall-E, chart from TradingView
