Recently, the cryptocurrency market has been amidst a relief period and Shiba Inu has not missed out on the opportunity to record gains. Its price was up by 23% over the last 72 hours and positive signs were visible on the hourly chart. However, a SHIB’s order book presented a different narrative and indicated that FUD was driving sentiment on Tuesday rather than bullish technicals. With sales rising on exchanges, here’s how to trade Shiba Inu heading forward.
Shiba Inu Hourly Chart
Source: TradingView
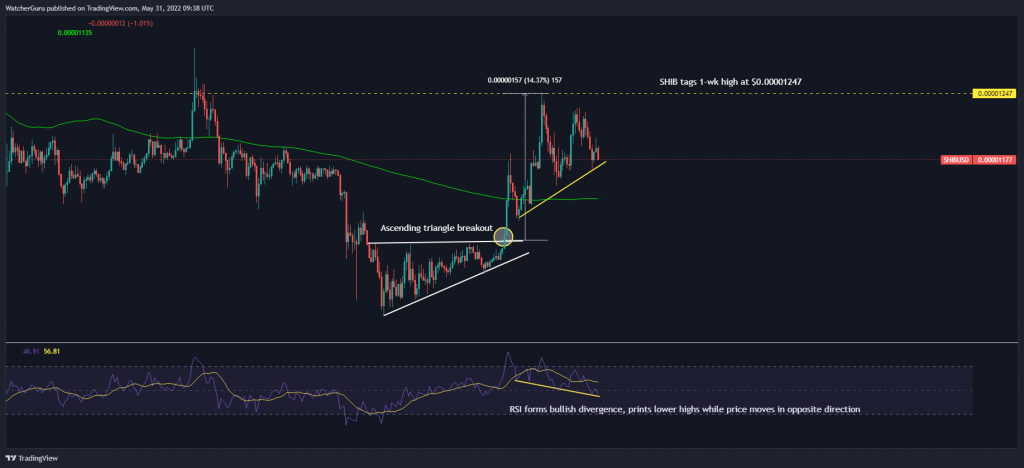
While Shiba Inu started to print green candles on 29 May amidst a risk-on broader market, its price gained momentum once it broke above a bullish ascending triangle. The development was followed by a 14% rally, enabling SHIB to tag a 1-wk high at $0.00001247. Now, simply by analyzing Shiba Inu’s hourly chart, one would be able to gauge its bullish near-term bias.
Since 27 May, Shiba Inu has constantly created and maintained support at higher levels on the chart – a chain of higher lows that was yet to be broken despite several correctional rounds. Furthermore, the hourly 200-SMA (green) was placed below the candles for the last three days – a development that is typically observed in bullish markets.
Additionally, the Relative Strength Index flashed a buy signal after forming a bullish divergence. Such divergences can occur when the oscillator falls to a fresh low while the price continues to shit higher.
Are traders moving against the bullish bias?
Source: IntoTheBlock
One would imagine that the technical developments and a risk-on broader market would encourage more buy orders on SHIB, right? Well, that wasn’t exactly the case. According to IntoTheBlock, traders were positioning for a downside move, with sell orders placed for nearly 900 Billion SHIB tokens in the past 12 hours. Buy orders were significantly lower in comparison.
It’s difficult to understand why traders were moving against the general trend, but the same could be in anticipation of profit-taking. Shiba Inu’s price has risen by 23% in the last 3 days and with the daily RSI (not shown) still lamenting around 35, there was plenty of incentive for traders to book their profits before the broader market witnesses another leg downwards.
How to trade Shiba Inu
Source: TradingView
With that in mind, a long setup could carry some risks going forward. Hence, a safer bet would be too short for Shiba Inu if it closes below the hourly 200-SMA (green). One can take a short position at $0.00001165 and cash out at $0.0000112. A stop-loss can be kept at $0.00001200. The hypothetical trade setup represented a risk/reward ratio of 1.39.
